


In the landscape of modern distributed systems, complexity is not a bug; it is a feature of scale. As organizations grow, monolithic architectures fracture into microservices. This shift offers agility and resilience, but it introduces a significant challenge: understanding how these independent units talk to one another. Without a clear map of communication flows, teams navigate a maze of dependencies, leading to slow debugging cycles, unintended side effects, and fragile deployments.
This guide explores a practical approach to mapping complex microservice communications. We will move beyond abstract theory to examine the mechanics of service interaction, the methods for documenting these relationships, and the strategies for maintaining clarity as the system evolves. The goal is not to build a static document, but to establish a living understanding of your distributed architecture.
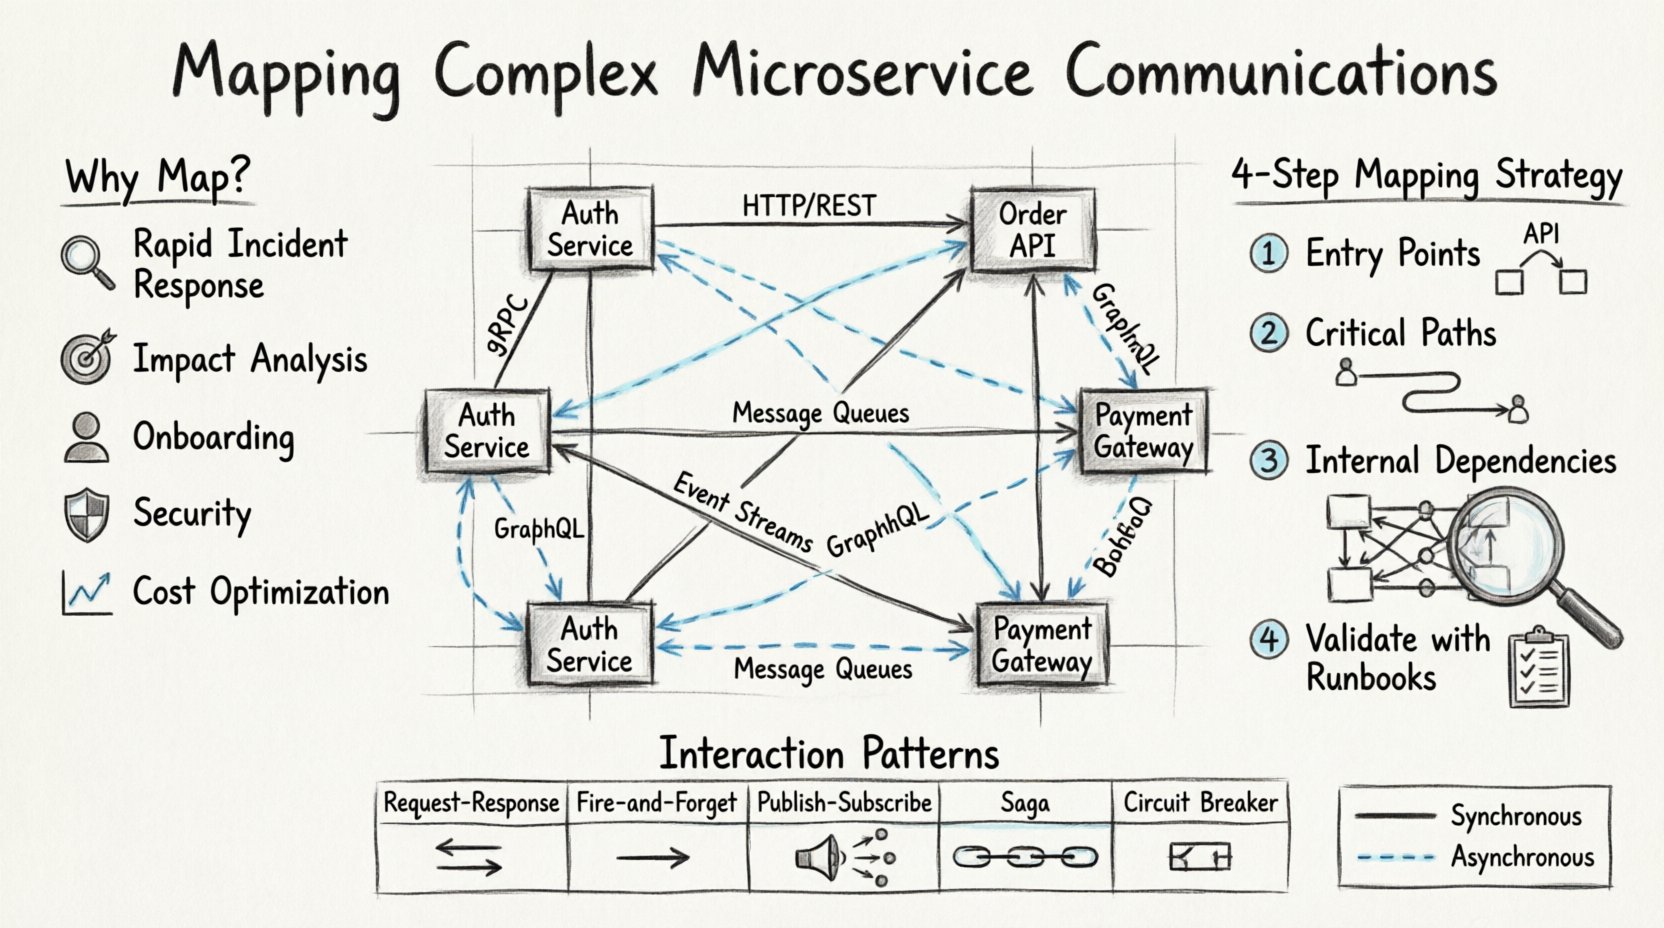
Why Visibility Matters in Distributed Systems 🧠
When a system consists of dozens or hundreds of services, the number of potential interaction paths grows exponentially. A single request from a client can traverse five different services, trigger two background jobs, and update three databases before a response is returned. Without a visual or documented representation of this path, engineers rely on fragmented knowledge.
Here are the core reasons why mapping communication is essential:
- Rapid Incident Response: When latency spikes or errors occur, knowing the exact flow of data allows engineers to isolate the failure point quickly.
- Impact Analysis: Before deploying a change to a specific service, you must know which other services depend on its current API contract.
- Onboarding Efficiency: New team members can understand the system architecture without needing to trace code through every repository.
- Security Compliance: Understanding data flow is critical for identifying where sensitive information is transmitted and ensuring it is encrypted appropriately.
- Cost Optimization: Identifying redundant calls or inefficient data transfers helps reduce infrastructure spend.
However, creating a map is not just about drawing boxes and lines. It is about capturing the logic, the protocols, and the constraints that govern the flow of information.
Defining the Scope of Communication 🚧
Before drawing a single diagram, it is necessary to define what constitutes a communication event. In microservice architectures, interactions generally fall into two primary categories: synchronous and asynchronous. Distinguishing between these is the first step in accurate mapping.
Synchronous Communication
Synchronous interactions occur when the caller waits for an immediate response. This is the traditional request-response model found in most web applications.
- HTTP/REST: The most common protocol. A client sends a request and blocks until the server responds.
- gRPC: Often used for internal service-to-service communication due to its performance and strong typing.
- GraphQL: Allows clients to request specific data structures, changing how services expose their endpoints.
Mapping these flows requires documenting the endpoints, the expected payloads, and the error handling strategies. If Service A calls Service B, does it wait for 5 seconds? What happens if Service B is unavailable? These details are critical for a complete map.
Asynchronous Communication
Asynchronous interactions decouple the sender from the receiver. The sender initiates a message and continues processing without waiting for a direct reply.
- Message Queues: Services publish messages to a queue, and consumers pick them up when ready.
- Event Streams: Services emit events to a log or stream, which other services subscribe to for processing.
- Background Jobs: Tasks triggered by an event but executed later.
Asynchronous flows are harder to map because the connection is implicit. There is no direct line between sender and receiver at runtime; they share a common channel. Documenting these requires listing the topics, the message schemas, and the subscription logic.
Interaction Patterns and Their Implications 🔄
Understanding the pattern of interaction helps determine the reliability and complexity of the system. Below is a comparison of common patterns used in distributed architectures.
| Pattern | Direction | Reliability | Use Case |
|---|---|---|---|
| Request-Response | Synchronous | High (requires retries) | User-facing APIs, immediate data needs |
| Fire-and-Forget | Asynchronous | Medium (depends on queue) | Logging, notifications, analytics |
| Publish-Subscribe | Asynchronous | High (with durable queues) | State changes, cross-domain events |
| Saga Pattern | Hybrid | High (compensating transactions) | Complex multi-step business processes |
| Circuit Breaker | Protective | Prevents cascading failures | Preventing downstream service overload |
When mapping your system, you should annotate each service interaction with the pattern being used. For example, a service calling a database is synchronous. A service sending an order confirmation email is asynchronous. A service orchestrating a checkout flow using multiple services might use the Saga pattern.
A Step-by-Step Mapping Strategy 🛠️
How do you go from a chaotic codebase to a clear diagram? Attempting to map everything at once often leads to burnout and incomplete data. A phased approach yields better results.
1. Identify the Entry Points
Start at the edge. Document the API Gateway or Load Balancer. What external requests enter the system? What protocols do they use? This defines the boundary of your diagram.
- List all public endpoints.
- Identify the authentication mechanisms.
- Map the routing rules that direct traffic to internal services.
2. Trace the Critical Paths
Do not try to map every single function. Focus on the critical business flows. For an e-commerce platform, this would be the checkout process. For a social network, it might be the feed generation or notification delivery.
- Follow a single user request from start to finish.
- Note every service touched along the way.
- Record the data being passed between each hop.
3. Document Internal Dependencies
Once the critical paths are mapped, look inward. How do services talk to each other outside of the main user flows? This includes health checks, configuration fetching, and batch processing jobs.
- Check service registries for known peers.
- Review configuration files for queue names or topic subscriptions.
- Inspect container orchestration manifests for sidecar proxies.
4. Validate with Runbooks
Documentation often becomes stale. The best validation method is to use the map during an incident. If you rely on a diagram to fix a bug and the steps don’t match reality, the map needs updating. Treat the diagram as a source of truth that must be tested.
Handling Asynchronous Flows and Event Streams 📬
Asynchronous communication is where many mapping efforts fail. Because there is no direct handshake, the coupling is hidden. To map this effectively, you must look at the infrastructure layer.
Centralizing Event Knowledge
Events are often defined in schema registries or documentation repositories. Creating a central index of all events allows you to see which services publish and which subscribe.
- Event Schemas: Define the structure of the data being sent. If the schema changes, the consumer must know.
- Topic Ownership: Who is responsible for maintaining the message broker? Who is responsible for the consumers?
- Backlog Monitoring: High lag in a queue indicates a processing bottleneck, which should be noted in the system status.
Visualizing the Flow
In a diagram, asynchronous flows should look different from synchronous ones. Use dashed lines to represent message queues and solid lines for direct calls. Label the dashed lines with the event name and the topic.
Consider the scenario where Service A publishes an OrderCreated event. Service B and Service C both subscribe to it. Service B processes payment, while Service C updates the inventory. Without a map, it is easy to forget that Service C exists or that it is dependent on the same event as Service B.
Managing Change and Evolution 🌱
A static map is a useless map. Services evolve, APIs break, and infrastructure changes. The goal is to create a process where the map updates naturally as the code changes.
Automated Discovery
While manual documentation is valuable, it is prone to drift. Where possible, use automated discovery tools to generate the underlying data for your diagrams. Tracing systems can record service-to-service calls and export them as dependency graphs.
- Integrate tracing data into the documentation pipeline.
- Set alerts for new dependencies that appear unexpectedly.
- Use code analysis to identify import statements that indicate potential dependencies.
Version Control for Diagrams
Treat architecture diagrams as code. Store them in the same repository as the application code. Require that any pull request changing a service interface includes a corresponding update to the diagram.
- Use a version control system to track changes over time.
- Review diagram changes in code review processes.
- Keep historical versions to understand how the architecture has shifted.
Common Pitfalls in Mapping 🚫
Even with a solid strategy, teams often fall into traps that reduce the utility of the map.
Circular Dependencies
When Service A calls Service B, and Service B calls Service A, you create a loop. This makes the system fragile and difficult to debug. Mapping should highlight these loops so they can be refactored.
- Identify cycles in the dependency graph.
- Refactor to break the cycle using events or shared interfaces.
- Document the reason for the cycle if it cannot be removed immediately.
Hidden Coupling
Services might share a database or a file system without explicit API calls. This is tight coupling disguised as loose coupling. It must be documented clearly, as it affects deployment strategies.
- Check for shared storage mounts.
- Review database connection strings for shared schemas.
- Document shared resources explicitly in the architecture.
Over-Engineering the Diagram
Trying to map every single function call results in a diagram that is too complex to read. Focus on the high-level flows and the critical paths. Details can be stored in code comments or API documentation.
- Use abstraction levels. High-level for management, low-level for engineers.
- Link detailed API docs to the high-level diagram nodes.
- Remove unnecessary internal logic from the map.
The Human Element of Diagrams 👥
Technology is only half the challenge. The other half is the team’s ability to understand and use the map. A diagram that no one reads is worse than no diagram at all.
Standardizing Notation
Ensure everyone on the team understands the symbols used. If you use a specific color for asynchronous flows, everyone must know that color represents that protocol. Consistency reduces cognitive load.
- Create a legend for your diagrams.
- Agree on naming conventions for services.
- Define standard icons for databases, queues, and external systems.
Accessibility and Distribution
Where is the diagram stored? If it is buried in a personal document drive, it is inaccessible. Store it in a central, searchable location accessible to all engineers.
- Host diagrams on the internal wiki or documentation site.
- Ensure the diagrams are rendered correctly in markdown viewers.
- Link to the diagrams from the service README files.
Encouraging Updates
Make updating the map part of the definition of done. If a developer changes the code but forgets the map, the work is incomplete. This cultural shift ensures the documentation stays relevant.
- Include diagram updates in the pull request checklist.
- Praise team members who keep documentation current.
- Regularly audit the maps against the running system.
Debugging with the Map 🐞
The ultimate test of a communication map is its utility during an incident. When the system is slow or broken, the map becomes a diagnostic tool.
- Trace the Request: Use the map to identify which service in the chain is likely to be the bottleneck.
- Check Health Status: Verify if the mapped dependencies are up and running.
- Analyze Logs: Look for errors in the services identified by the map.
- Validate Config: Ensure the configuration matches the map (e.g., queue names, endpoint URLs).
If the map is accurate, it reduces the Mean Time To Resolution (MTTR) significantly. Engineers can skip the guesswork and focus on the specific node that requires attention.
Maintaining Clarity Over Time ⏳
As the system scales, the map will grow. To prevent it from becoming a tangled web, you must manage its complexity.
- Layered Views: Create different diagrams for different audiences. High-level for executives, detailed for engineers.
- Service Ownership: Assign ownership of specific diagrams to specific teams. This ensures someone is responsible for accuracy.
- Regular Reviews: Schedule quarterly reviews of the architecture to prune dead code and update flows.
- Feedback Loops: Allow engineers to suggest corrections to the diagrams when they encounter discrepancies in production.
By treating the map as a living artifact, you ensure it remains a valuable asset rather than a historical relic. The complexity of microservices is inevitable, but the chaos surrounding it is optional. With a disciplined approach to mapping, you can navigate the distributed landscape with confidence and clarity.