


Visualizing system interactions is a critical skill for any developer or architect. While code defines logic, diagrams define flow. Among the Unified Modeling Language (UML) suite, Communication Diagrams offer a unique perspective on how objects collaborate to achieve a specific behavior. Unlike sequence diagrams that prioritize time, communication diagrams emphasize the structural relationships and links between objects. This guide provides a comprehensive breakdown of the symbols, rules, and best practices needed to create clear, effective diagrams.
What is a Communication Diagram? 🤔
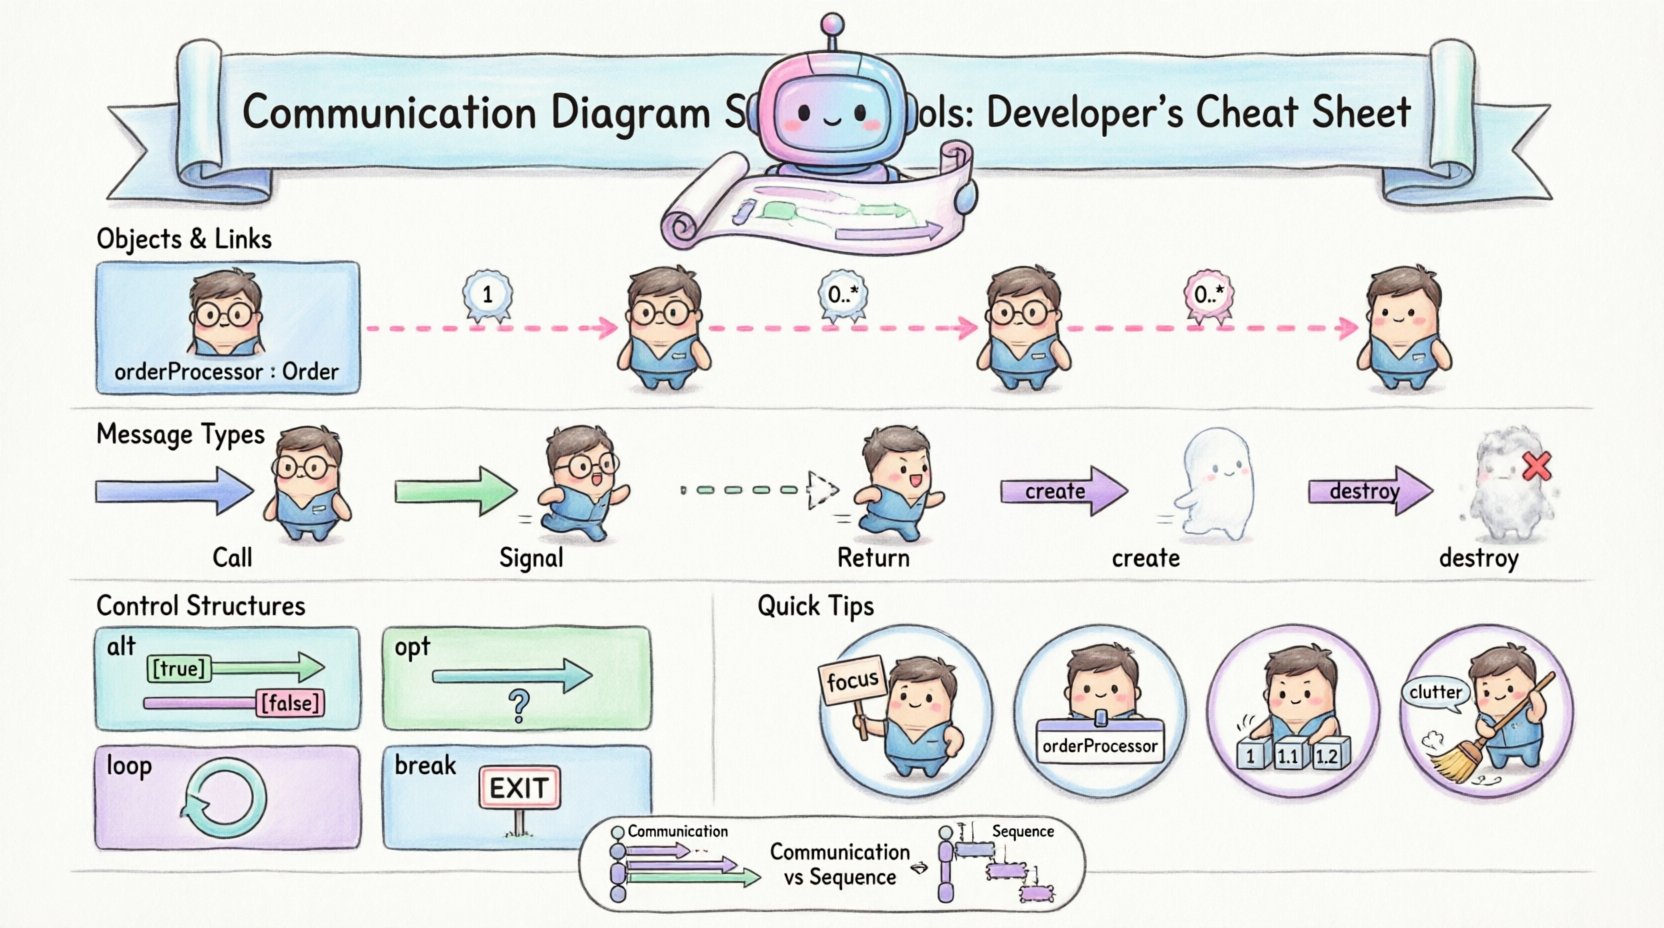
A Communication Diagram, formerly known as a Collaboration Diagram, illustrates the interactions between objects in terms of sequenced messages. It focuses on the static structure of the system. The primary elements include:
- Objects: Instances of classes participating in the interaction.
- Links: Structural connections between objects.
- Messages: The flow of information or control between objects.
- Activations: Periods during which an object is performing an action.
Developers often turn to this notation when the focus is on who is talking to whom rather than strictly when. This structural view helps in understanding the topology of the system architecture.
Core Symbols and Notation 🔍
To read and create these diagrams effectively, you must understand the standard notation. Below is a detailed breakdown of the fundamental building blocks.
1. Objects and Instances 📦
Objects are represented by rectangles. They display the name of the instance and the class it belongs to, separated by a colon. For example, an instance named orderProcessor of class Order is written as orderProcessor : Order.
- Name: Identifies the specific instance. Often italicized.
- Class Name: Defines the type. Always in standard font.
- Positioning: Objects are placed freely on the canvas, unlike sequence diagrams where they are aligned in vertical columns.
2. Links and Associations 🔗
Links represent the structural paths along which messages travel. They correspond to associations defined in the class diagram.
- Direction: Can be unidirectional or bidirectional.
- Labels: Navigation paths may be labeled to indicate which direction the message can flow.
- Multiplicity: Indicates how many instances can be connected at a link end (e.g., 1, 0..*, 1..*). This is crucial for understanding the constraints of the relationship.
3. Messages and Interactions 💬
Messages are the lifeblood of the diagram. They are depicted as arrows connecting objects. The arrow points from the sender to the receiver.
- Numbering: Sequential numbers (1, 2, 3) indicate the order of execution. Nested numbers (1.1, 1.2) indicate sub-messages within a primary message.
- Text: The label on the arrow describes the operation being called or the signal being sent.
- Return Messages: Represented by dashed arrows pointing back to the sender.
Message Types Explained 📥
Not all arrows are created equal. The style of the arrowhead and the line style convey specific behavioral semantics.
| Symbol Style | Message Type | Description |
|---|---|---|
| Solid Arrowhead | Call | Standard method invocation. The sender waits for a response. |
| Open Arrowhead | Signal | Asynchronous message. The sender does not wait for a response. |
| Dashed Arrow | Return | Response to a call or signal. Often implied but can be explicit. |
| Open Arrow + ‘create’ | Creation | Indicates the instantiation of a new object. |
| Open Arrow + ‘destroy’ | Destruction | Indicates the removal of an object instance. |
Call Messages
A call message represents a synchronous operation. The sender suspends its own activity until the receiver completes the task. This is the most common type of interaction in standard procedural flows.
Signal Messages
Signals are asynchronous. The sender transmits the message and continues its own execution immediately. This is common in event-driven architectures where decoupling is necessary.
Self-Messages
When an object calls a method on itself, the arrow loops back to the same object. This is often used to show internal processing steps that do not involve external collaboration.
Activation and Timing ⏱️
While communication diagrams are not time-based like sequence diagrams, they still convey execution duration through Activation Bars.
- Appearance: A thin rectangle drawn on the link connecting to the object.
- Meaning: It indicates the period during which the object is performing the action associated with the incoming message.
- Duration: The length of the bar does not represent real time, but rather the relative complexity or duration of the task compared to other tasks.
Understanding activation helps developers identify bottlenecks. If an object has multiple overlapping activations, it implies high concurrency or complex internal processing.
Object Lifecycle: Creation and Destruction 🔄
Objects in a system are not static. They are created, used, and destroyed. The diagram notation supports this lifecycle explicitly.
Creation Symbols
When a message results in a new object, a dashed arrow with an open arrowhead is used. The label typically reads <<create>> or simply create. The target object is the new instance being born.
Destruction Symbols
Conversely, when an object is no longer needed, it is destroyed. This is shown by a dashed arrow with an open arrowhead pointing to the object, labeled <<destroy>> or destroy. This is often marked with a small ‘X’ on the link to signify termination.
Control Structures and Logic 🧠
Real-world systems involve logic branches, loops, and conditions. Communication diagrams handle these using Interaction Fragments.
- Alt (Alternative): Represents an if-else structure. Multiple fragments are enclosed in a box labeled
alt. Each fragment has a guard condition (e.g., [condition is true]). - Opt (Optional): Represents an optional interaction. Enclosed in a box labeled
optwith a guard condition. - Loop: Represents a standard loop. Enclosed in a box labeled
loopwith iteration conditions. - Break: Represents an exception or early exit. Enclosed in a box labeled
break.
These structures allow the diagram to describe complex flows without cluttering the visual with too many separate arrows. They define the context for the messages contained within them.
Best Practices for Clarity ✨
A diagram that is hard to read is useless. Follow these guidelines to ensure your diagrams serve their purpose.
1. Limit Object Count
Do not include every object in the system. Focus on the specific scenario or use case you are documenting. Too many objects create visual noise and obscure the primary interaction path.
2. Use Consistent Naming
Ensure object names match the codebase. If the class is UserService, do not label the instance Helper. Consistency reduces cognitive load for developers reading the diagram later.
3. Number Messages Logically
Message numbering should reflect the logical flow. If a message triggers a sub-process, use decimal numbering (1.1, 1.2). This helps in tracing the execution path without guessing the order.
4. Avoid Redundant Return Messages
Unless the return value is significant or complex, do not draw every return arrow. It clutters the diagram. Focus on the control flow rather than data returns.
5. Group Related Interactions
Use frames or boxes to group interactions that belong to a single transaction or logical unit. This helps in breaking down complex flows into manageable chunks.
Communication vs. Sequence Diagrams 🆚
Developers often ask which diagram to use. Both share the same semantic meaning but differ in presentation.
- Sequence Diagram: Prioritizes time. Vertical axis represents time. Best for complex timing scenarios and strict ordering.
- Communication Diagram: Prioritizes structure. Horizontal/2D layout represents links. Best for understanding the object topology and navigation paths.
If you need to show that Object A must talk to Object B before Object C talks to Object A, a sequence diagram is clearer. If you need to show that Object A talks to Object B, C, D, and E in a star pattern, a communication diagram is often more compact.
Common Pitfalls to Avoid ⚠️
Even experienced practitioners make mistakes. Watch out for these common errors.
- Mixing Notations: Do not combine sequence diagram vertical lifelines with communication diagram links. Choose one style and stick to it.
- Overcrowding: Trying to fit the entire system architecture into a single diagram. Split diagrams by feature or module.
- Ambiguous Labels: Using generic terms like
processorhandlewithout specifying the method name. Be specific. - Ignoring Multiplicity: Failing to show that a link allows multiple objects. This can lead to runtime errors if the implementation assumes a singleton relationship.
Step-by-Step Creation Guide 🛠️
When you sit down to draw a diagram, follow this workflow.
- Identify the Scenario: Define the specific user action or system event you are modeling.
- List the Actors and Objects: Determine which classes are involved in this specific flow.
- Draw the Objects: Place the rectangles on the canvas. Group related objects together spatially.
- Draw the Links: Connect the objects based on the class diagram associations.
- Add Messages: Draw the arrows in the order of execution. Number them sequentially.
- Refine: Add activation bars, guard conditions, and labels for clarity.
- Review: Check against the code logic to ensure accuracy.
Advanced Scenarios 🔥
Some interactions require more advanced notation.
Recursion
When an object calls a method on itself repeatedly, use a self-loop arrow. This is common in tree traversal or recursive algorithms. Label the loop to indicate the base case condition.
Exception Handling
Use the break fragment to show when an exception interrupts the normal flow. This is critical for documenting error paths that developers might otherwise overlook.
Parameter Passing
You can include parameter values in the message label. For example, login(username, password). This adds precision but should be used sparingly to avoid clutter.
Conclusion 🎯
Mastering the symbols of communication diagrams allows you to document complex systems with precision and clarity. By understanding the nuances of objects, links, and messages, you can create diagrams that serve as a reliable reference for your team. Remember that the goal is communication, not just documentation. Keep your diagrams simple, consistent, and focused on the specific behavior being described.
Use this cheat sheet as a reference when you encounter complex interaction flows. Regularly update your diagrams as the system evolves. A living diagram is a valuable asset that prevents technical debt from accumulating in your documentation.
With practice, reading and creating these diagrams will become second nature. You will find that they help you spot design flaws early and communicate architectural decisions more effectively.