


Systems analysis relies heavily on visual modeling to communicate complex logic to stakeholders and developers. However, a common point of confusion for students entering this field is the distinction between state diagrams and flowcharts. Both are graphical representations used to model processes, yet they serve fundamentally different purposes within the architecture of a software system. Understanding when to apply a state machine diagram versus a control flow diagram is critical for accurate requirements gathering and system design.
This guide explores the structural and functional differences between these two modeling techniques. We will examine how they handle data, events, and control logic, ensuring you build robust models that reflect the true behavior of the systems you analyze. 🧠
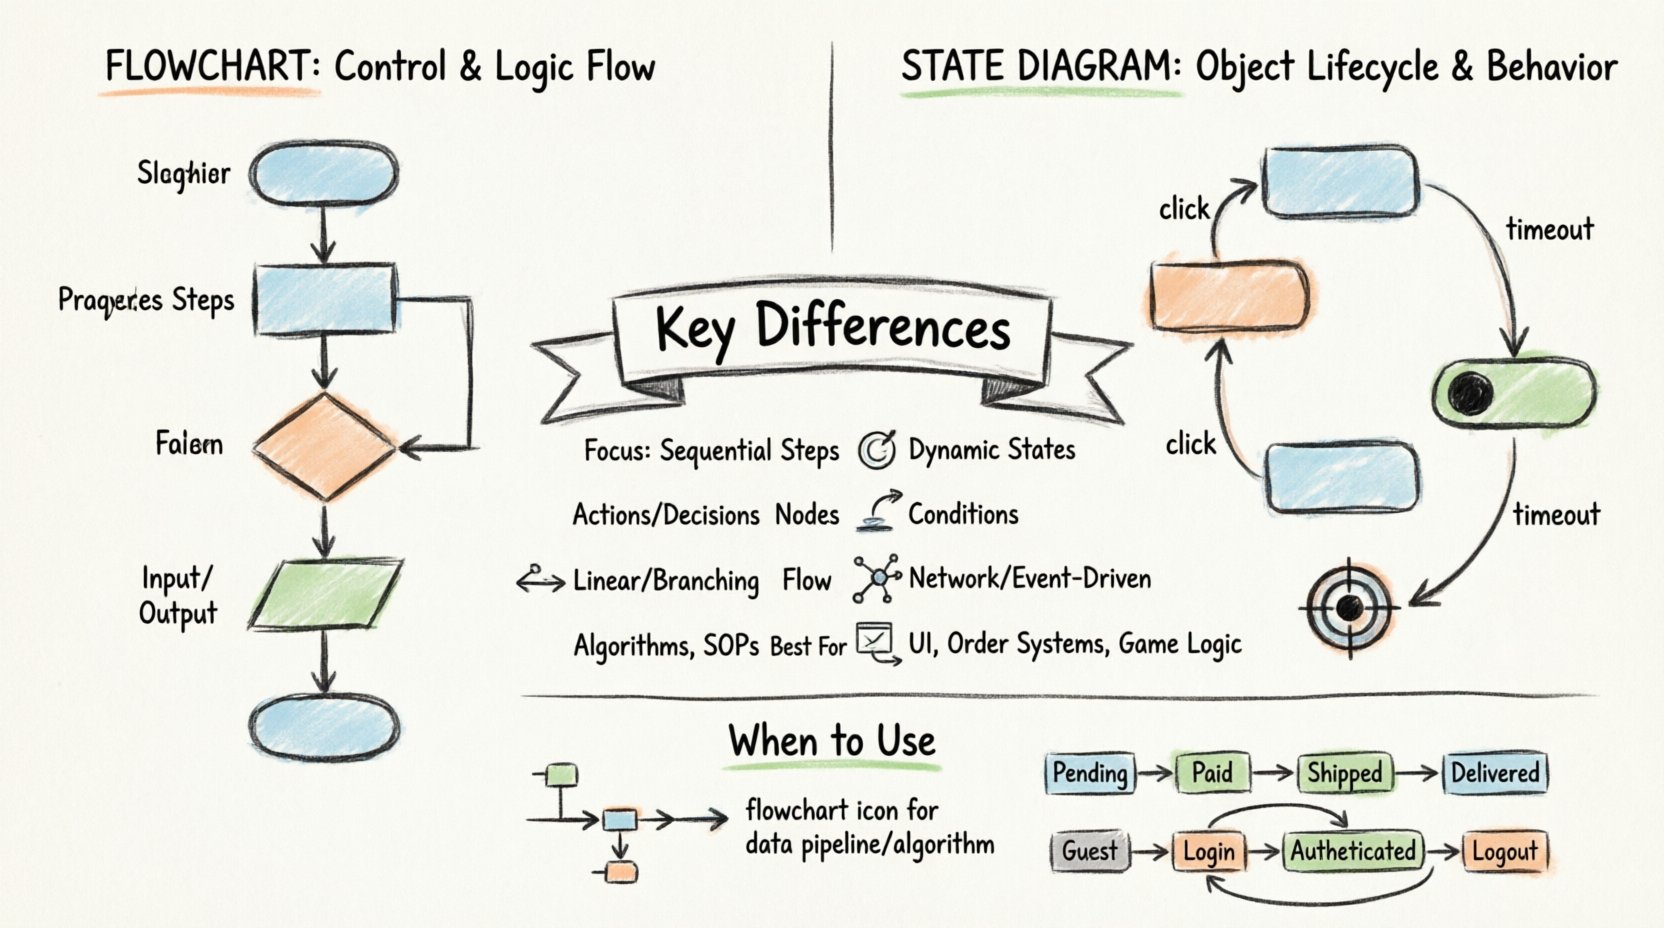
Understanding the Flowchart: Control and Logic Flow 🔄
A flowchart is a diagram that represents a workflow or process. It uses a sequence of shapes to show the steps and decisions involved in a specific task. In systems analysis, flowcharts are traditionally used to map out the procedural logic of a system. They focus on the how of a process—how data moves from one step to another and how decisions branch the path forward.
Core Components of a Flowchart
Flowcharts rely on standardized symbols to convey meaning. While variations exist, the most common elements include:
- Terminator: Ovals that mark the start and end points of the process.
- Process: Rectangles indicating an action or operation to be performed.
- Decision: Diamonds representing a point where the flow branches based on a condition (yes/no or true/false).
- Input/Output: Parallelograms showing data entry or display operations.
- Flow Lines: Arrows connecting the symbols to indicate the direction of control flow.
The Focus: Sequential Logic
The primary strength of a flowchart lies in its ability to depict sequential logic. If you are analyzing a payroll calculation routine, a flowchart effectively shows the steps: retrieve employee data, check tax status, calculate deduction, update ledger, and print report. The flow is linear, branching only when specific conditions are met. This makes flowcharts excellent for documenting algorithms or business rules that follow a strict order.
However, flowcharts can become unwieldy when modeling systems with complex event-driven behaviors. If a system can be in multiple states simultaneously or if the order of operations depends on external events rather than a fixed sequence, a flowchart may struggle to convey the complexity without becoming a tangled “spaghetti” diagram. 🕸️
Understanding State Diagrams: Object Lifecycle and Behavior 🔄
A state diagram, often referred to as a state machine diagram in UML (Unified Modeling Language), focuses on the behavior of a specific object or system component over time. Unlike flowcharts, which track the flow of control, state diagrams track the state of an entity. They answer the question: What condition is the object in, and how does it react to events?
Core Components of a State Diagram
State diagrams utilize a different set of visual elements tailored to lifecycle modeling:
- State: A condition or situation during the lifecycle of an object where it satisfies some condition, performs some activity, or waits for an event. These are typically shown as rounded rectangles.
- Transition: A link between two states, indicating a change from one state to another. Transitions are usually triggered by events.
- Event: Something that happens at a specific point in time, such as a user clicking a button or a sensor reading a value.
- Initial State: A filled circle indicating the starting point of the state machine.
- Final State: A circle with a dot inside, representing the termination of the lifecycle.
- Actions: Activities performed when entering or exiting a state, or during a transition (e.g., “On Entry: Send Notification”).
The Focus: Dynamic Behavior
State diagrams excel at modeling reactive systems. Consider an online order system. An order is not just a process; it has a lifecycle. It starts as “Pending,” moves to “Paid,” then “Shipped,” and finally “Delivered.” If the payment fails, it moves to “Failed.” A state diagram clearly visualizes these distinct statuses and the valid paths between them. It ensures that an order cannot jump from “Pending” to “Delivered” without passing through the intermediate payment and shipping stages.
This distinction is vital for systems analysis. It forces the analyst to think about the internal conditions of the system, not just the sequence of steps. It prevents invalid states and ensures the system behaves predictably regardless of the order in which events occur. ⚙️
Structural Differences: A Detailed Comparison 📝
To clarify the distinctions, we must look at how these diagrams handle specific modeling concepts. The table below outlines the primary structural differences between flowcharts and state diagrams.
| Feature | Flowchart | State Diagram |
|---|---|---|
| Primary Focus | Control flow and algorithmic steps. | Object lifecycle and internal states. |
| Node Meaning | Process, decision, or action. | State (a condition of existence). |
| Flow Direction | Linear with branches. | Network of states (often non-linear). |
| Events | Implicit in decisions. | Explicit triggers for transitions. |
| Concurrent Behavior | Difficult to represent. | Supported via sub-states or history. |
| Best Use Case | Procedural logic, algorithms. | User interfaces, complex business rules. |
When to Use Each Technique in Systems Analysis 🎯
Choosing the right tool depends on the nature of the system you are analyzing. Using a flowchart for a complex object lifecycle can lead to confusion, while using a state diagram for a simple linear calculation can be overkill. Here is a breakdown of appropriate usage scenarios.
Scenarios for Flowcharts
Use flowcharts when the logic is procedural and the order of operations is fixed. Examples include:
- Data Processing Pipelines: How data is extracted, transformed, and loaded (ETL) into a database.
- Algorithm Design: Steps to sort a list of numbers or calculate a mathematical formula.
- Standard Operating Procedures: Step-by-step instructions for a human user to follow in a workflow.
- Decision Trees: Simple if-then-else logic structures without complex state dependencies.
In these cases, the emphasis is on the path taken. The system is a vehicle moving from point A to point B, and the flowchart maps the road.
Scenarios for State Diagrams
Use state diagrams when the behavior depends on the history or current status of an object. Examples include:
- User Authentication: A session can be “Logged Out,” “Authenticated,” “Locked Out,” or “Expired.” The valid actions depend entirely on the current status.
- Order Management: As mentioned earlier, an order has a lifecycle that cannot be violated (e.g., you cannot cancel a “Shipped” order without returning it).
- Device Control: A thermostat that cycles between “Heating,” “Cooling,” and “Off” based on temperature triggers.
- Game Logic: Character health states (Alive, Dying, Dead) where actions like “Heal” are only valid in specific states.
Here, the emphasis is on the condition of the object. The system is an actor with a personality and a history, and the state diagram maps its reactions.
Common Pitfalls in Modeling 🚧
Systems analysis students often make specific mistakes when transitioning between these two modeling techniques. Being aware of these pitfalls can save you time during the design phase.
Pitfall 1: Mixing Logic and State
A common error is trying to model the entire system state within a flowchart. This leads to massive, unreadable diagrams where decision diamonds represent state changes rather than simple conditions. For instance, asking “Is the user logged in?” as a decision diamond in a flowchart is less effective than defining a “Logged Out” state in a state diagram. The former checks a flag; the latter manages a lifecycle.
Pitfall 2: Ignoring the Start and End Points
In state diagrams, every object must have a defined initial state and a defined final state (or a termination condition). Students sometimes draw state diagrams that float without entry or exit points. This makes it impossible to determine how the system initializes or how it shuts down gracefully. Always ensure the initial state connects to the first valid state and the final state is reachable from all other states.
Pitfall 3: Over-Complicating with Events
Conversely, some students use state diagrams for simple linear processes. If a process is strictly sequential (Step A → Step B → Step C), a state diagram adds unnecessary complexity. The extra nodes and event labels can obscure the simple flow of logic. Keep it simple: use flowcharts for linear logic.
Pitfall 4: Ambiguous Transitions
Transitions in state diagrams must be triggered by specific events. A common mistake is drawing transitions that rely on implicit time or conditions that aren’t explicitly defined. Every arrow leaving a state should ideally be labeled with the event that causes the transition (e.g., “On Timeout,” “On Click,” “On Error”). This clarity is essential for developers implementing the system.
Best Practices for Systems Analysis Students 💡
To master these modeling techniques, students should adopt specific habits during their analysis and design phases. Consistency and clarity are more important than adhering strictly to every minor notation rule.
- Start with the Entity: Before drawing, identify the object you are modeling. Is it a process (use flowchart) or an object (use state diagram)?
- Define Boundaries: Clearly mark where the process begins and ends. Do not leave dangling arrows.
- Keep States Atomic: Ensure each state represents a single, coherent condition. Avoid combining multiple independent attributes into one state box.
- Use Hierarchy: For complex systems, use nested states (sub-states). This keeps the high-level diagram clean while allowing detailed behavior in the expanded view.
- Validate with Scenarios: Walk through user stories to see if the diagram holds up. If a user story implies a state you haven’t defined, add it.
- Avoid Redundancy: If a transition is possible from multiple states to the same state, consider consolidating the logic or using a common entry point.
Theoretical Underpinnings: Finite State Machines 🧮
Understanding the theory behind state diagrams provides a deeper authority in systems analysis. State diagrams are visual representations of Finite State Machines (FSM). An FSM is a mathematical model of computation used to design both computer programs and sequential logic circuits.
An FSM consists of:
- A finite number of states.
- A set of inputs.
- A transition function that determines the next state based on the current state and input.
Flowcharts, by contrast, are more aligned with Control Flow Graphs (CFGs) used in compiler design. CFGs focus on the execution order of instructions. Recognizing this theoretical difference helps when explaining your modeling choices to technical stakeholders. You are not just drawing pictures; you are choosing between modeling a computational state (FSM) or a computational path (CFG).
Integration in the Development Lifecycle 🔗
These diagrams do not exist in a vacuum. They play specific roles in the software development lifecycle (SDLC).
Requirements Gathering: Flowcharts are often used to document business requirements. They help non-technical stakeholders understand the process flow. State diagrams are used to document functional requirements regarding object behavior.
Design Phase: During design, state diagrams guide the implementation of the state management logic. Developers use them to write switch-case statements or state machine libraries. Flowcharts guide the implementation of algorithmic functions.
Testing: State diagrams are crucial for testing. Test cases can be generated to cover every state and every transition. This is known as state transition testing. Flowcharts are used to generate test paths to ensure all branches of the logic are executed (branch coverage).
Final Thoughts on Modeling Strategy 🤔
Selecting between a state diagram and a flowchart is not merely a stylistic choice; it is a strategic decision that impacts the clarity and maintainability of your system design. By understanding the distinct capabilities of each, you ensure that your models communicate the right information to the right audience.
Flowcharts provide the roadmap for processes, guiding the flow of control through logic gates. State diagrams provide the blueprint for behavior, ensuring objects exist in valid conditions and react correctly to the world around them. As a systems analyst, your ability to distinguish and apply these tools accurately defines the quality of your architectural work.
Focus on the nature of the problem you are solving. Is it a journey? Use a flowchart. Is it a life cycle? Use a state diagram. With practice, the distinction will become intuitive, allowing you to model complex systems with precision and clarity.