


Understanding where money is made within an industry is the difference between survival and sustained growth. Many businesses focus solely on their own operations, missing the bigger picture of where the value actually accumulates. This accumulation of value is known as a profit pool. To map these pools effectively, leaders rely on strategic frameworks. One of the most enduring and powerful tools for this task is Porter’s Five Forces Analysis.
By combining a deep understanding of profit pool dynamics with the structural insights provided by the Five Forces, organizations can pinpoint exactly which segments of the value chain offer the highest returns. This guide breaks down the mechanics of this integration, offering a clear path to identifying high-value opportunities without relying on hype or generic advice. We will explore the specific economic levers at play and how to measure them.
What Exactly is a Profit Pool? 💵
A profit pool represents the total profits earned in an industry at all levels of the value chain. It is not merely about revenue; it is about the net margin remaining after costs. A classic example involves the automotive industry. Historically, the profit pool for new car sales was massive. However, over time, that pool shifted significantly toward services, financing, and parts. The manufacturing of the vehicle itself became less profitable than the ecosystem surrounding it.
Identifying these pools requires looking beyond the product you sell today. It requires a structural view of the entire industry ecosystem. Key characteristics of a profit pool include:
- Volume vs. Margin: Some segments offer high volume but low margins (e.g., commodity trading). Others offer low volume but high margins (e.g., specialized consulting or proprietary software).
- Lifecycle Stage: Emerging technologies often have small pools with high growth potential, while mature industries might have large pools with stagnant growth.
- Geography: Profit pools are often geographically segmented. A strategy that works in North America may not capture the same value in Southeast Asia due to different cost structures and competitive dynamics.
When you identify a profit pool, you are identifying where the money is made. The strategic question then becomes: How do we position our company to capture a larger share of that pool?
The Five Forces Framework: A Strategic Lens ⚔️
Michael Porter introduced the Five Forces framework to describe the competitive intensity and attractiveness of a market. While often used to assess overall industry attractiveness, its true power lies in dissecting the specific forces that erode or protect margins in different segments of the value chain.
Each force acts as a pressure valve on profitability. If a force is strong, it squeezes profits. If it is weak, it allows for higher margins. To find a profit pool, you must analyze which segments are shielded from these pressures.
The five forces are:
- Threat of New Entrants: How easy is it for new competitors to enter the market?
- Bargaining Power of Suppliers: How much control do suppliers have over pricing?
- Bargaining Power of Buyers: How much control do customers have over pricing?
- Threat of Substitute Products: Are there alternative ways for customers to solve their problem?
- Rivalry Among Existing Competitors: How intense is the competition between current players?
Mapping Forces to Profit Pools 🗺️
The core of this strategy lies in mapping each force against specific segments of the value chain. A segment might be highly profitable not because demand is high, but because the forces are weak in that specific area. Below is a detailed breakdown of how each force impacts profit pool identification.
1. Threat of New Entrants 🚪
High barriers to entry protect existing profit pools. If it is expensive or difficult to start a business in a specific segment, the profits there are safer.
- Capital Requirements: Segments requiring heavy infrastructure investment (e.g., semiconductor manufacturing) often have fewer players and higher barriers, protecting margins.
- Regulatory Hurdles: Industries with strict licensing (e.g., pharmaceuticals, banking) tend to have concentrated profit pools.
- Switching Costs: If customers find it difficult to switch to a new entrant, the incumbent retains the profit pool.
Strategic Insight: Look for segments where capital intensity is high or regulatory hurdles are steep. These areas often contain the most stable profit pools because new competitors cannot easily disrupt them.
2. Bargaining Power of Suppliers 📦
Supplier power directly eats into margins. If you rely on a single source for a critical component, your profit pool shrinks.
- Concentration: If suppliers are few and buyers are many, suppliers dictate prices.
- Uniqueness: Proprietary technology or specialized materials increase supplier power.
- Threat of Forward Integration: If a supplier can easily become a competitor, they will hold the line on pricing.
Strategic Insight: Avoid segments where supplier power is high. Instead, seek parts of the value chain where you can source inputs commoditizedly or where you control the input yourself (backward integration).
3. Bargaining Power of Buyers 🛒
Buyers demand lower prices and higher quality. High buyer power compresses the profit pool.
- Volume: Large buyers can negotiate significant discounts.
- Price Sensitivity: If the product is a commodity, buyers will always choose the cheapest option.
- Information Availability: When buyers know the cost structure better than sellers, margins suffer.
Strategic Insight: Target niche segments where buyers are fragmented or where the product offers unique differentiation that reduces price sensitivity. This is where the profit pools are often hidden.
4. Threat of Substitute Products 🔄
Substitutes place a ceiling on prices. If a customer can solve their problem differently, they will not pay a premium.
- Price-Performance Trade-off: Substitutes often offer better value for money.
- Switching Costs: Low switching costs increase the threat.
- Changing Preferences: Cultural shifts can make entire product categories obsolete.
Strategic Insight: Analyze the functional need, not just the product category. For example, if you sell coffee beans, your substitute is not just tea, but energy drinks or even sleep apps. Identifying the true substitute helps you find the profit pool in the solution, not just the commodity.
5. Rivalry Among Existing Competitors 🥊
Intense rivalry leads to price wars, marketing spend, and innovation races that drain the profit pool.
- Number of Competitors: More players usually mean more competition.
- Industry Growth: In slow-growth industries, fighting for market share is zero-sum and destructive.
- Differentiation: If products are identical, price becomes the only lever.
Strategic Insight: Avoid saturated markets where competitors fight on price. Look for segments where differentiation is possible, or where you can change the rules of the game.
Step-by-Step Implementation Process 🛠️
Applying this analysis requires a disciplined approach. It is not enough to understand the theory; you must execute the data gathering and mapping. Follow this structured process to identify the profit pools in your specific market.
Step 1: Define the Industry Boundaries
Before analyzing, you must define what constitutes the industry. Is it just the hardware? Does it include the software? Does it include the after-market service? Broad definitions often dilute the analysis. Narrow definitions reveal the pockets of high profitability.
- List all activities involved in delivering the value.
- Identify where value is added at each stage.
- Exclude peripheral activities that do not directly impact the core value proposition.
Step 2: Map the Value Chain
Create a visual map of the value chain. This includes R&D, manufacturing, distribution, marketing, sales, and customer service. Assign revenue and cost data to each segment if available. This helps visualize where the money flows.
Step 3: Assess the Five Forces per Segment
Do not apply the forces to the industry as a whole. Apply them to each segment of the value chain. For example, the threat of new entrants might be high in the software development segment but low in the hardware manufacturing segment.
| Value Chain Segment | Force Impact | Profit Pool Potential |
|---|---|---|
| Raw Materials | High Supplier Power | Low |
| Manufacturing | High Rivalry | Medium |
| After-Sales Service | Low Substitution | High |
| Financing | High Entry Barriers | High |
Step 4: Quantify the Margins
Revenue is vanity; profit is sanity. Calculate the net margin for each segment. A segment with high revenue but low margin is not a profit pool. Look for the segments where the ratio of profit to revenue is highest.
- Collect financial data from public competitors.
- Analyze internal P&L statements.
- Estimate industry-wide margins for segments you do not directly serve.
Step 5: Identify Strategic Gaps
Compare your current position with the high-margin segments identified. Where are you missing out? Is it a capability issue? Is it a regulatory issue? Is it a capital issue? This gap analysis points directly to where you can expand your profit pool.
Common Mistakes to Avoid 🚫
Even with a solid framework, execution errors can lead to flawed conclusions. Avoid these common pitfalls when analyzing profit pools.
- Focusing on Revenue Only: High revenue does not equal high profit. A segment with 50% market share but 1% margins is less attractive than a niche with 5% share and 20% margins.
- Static Analysis: Markets change. A profit pool today might vanish tomorrow due to technological shifts. Update your analysis regularly.
- Ignoring Complementary Goods: Sometimes the profit pool lies in the products that work with your own. Ignoring the ecosystem limits your view.
- Assuming Homogeneity: Not all customers are the same. Segmentation is key. One segment of buyers might be price-sensitive, while another is value-sensitive.
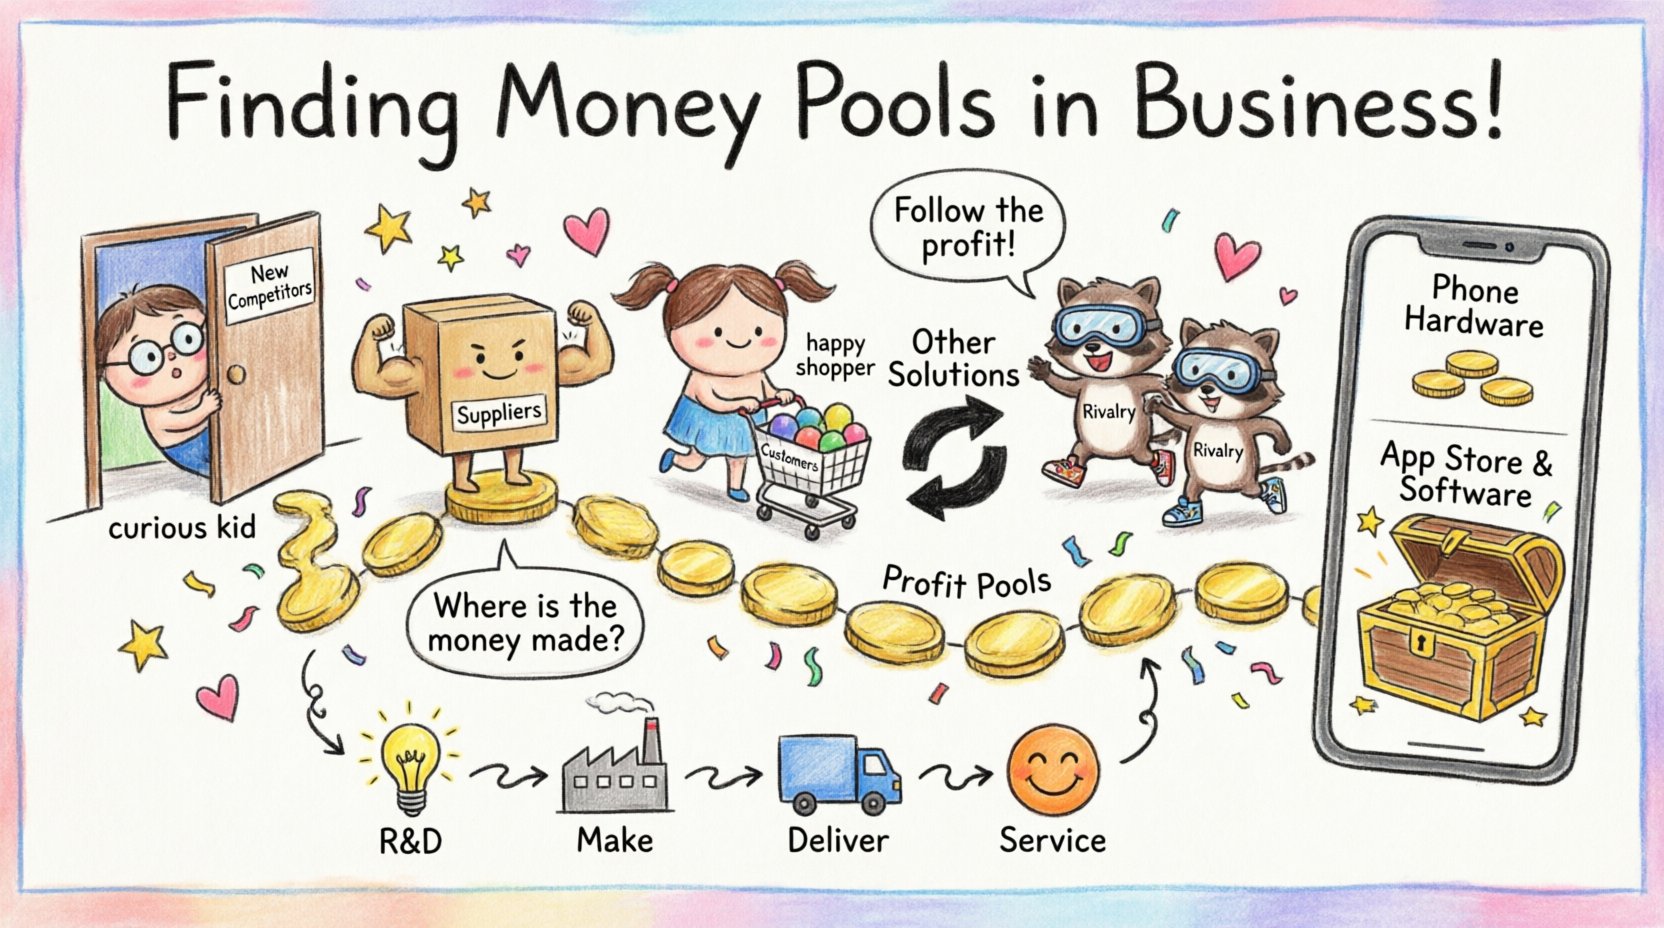
Case Study: The Smartphone Industry 📱
To illustrate this in practice, consider the smartphone industry. At first glance, it seems like a hardware battle. However, a Five Forces analysis reveals the true profit pools.
Hardware Manufacturing: High rivalry. Low differentiation. High capital requirements. Suppliers (chip makers) have significant power. The profit pool here is relatively thin.
Operating Systems: High barriers to entry. Network effects protect incumbents. The profit pool here is massive. The OS provider captures the value of the entire ecosystem.
App Stores: High buyer power is mitigated by the lack of alternatives for users. The platform owner takes a cut of every transaction. This is a high-margin profit pool.
Accessories: Low barriers to entry. High rivalry. Low margins.
Analysis: A company focused solely on selling phones (hardware) captures less value than one that controls the OS or the App Store. The profit pool is clearly in the software and services layer, protected by high switching costs and network effects.
Final Thoughts on Strategic Positioning 🧭
Finding the profit pool is not a one-time exercise. It is an ongoing discipline. As industries evolve, the forces shift, and the pools move. Companies that understand the underlying mechanics of profitability can pivot their resources to chase the value before their competitors do.
By rigorously applying Porter’s Five Forces to specific segments of the value chain, you move beyond guesswork. You gain a structural understanding of where margins are protected and where they are under siege. This clarity allows for better capital allocation, smarter M&A decisions, and more focused product development.
Remember, the goal is not just to participate in the market, but to capture the value where it is most abundant. Use these forces as a diagnostic tool to audit your current position and identify the next area for growth. The data is there; the framework is ready. The decision rests on your ability to execute the analysis.