


Delivering strategic insights requires more than just data; it demands a narrative that resonates with decision-makers. When presenting complex market analyses, the Porter’s Five Forces Framework offers a robust structure for organizing competitive intelligence. This method moves beyond simple observation to provide a systematic evaluation of industry attractiveness. For consultants and strategists, the challenge lies not only in performing the analysis but in translating it into a compelling client presentation.
This guide outlines how to construct a presentation that leverages this framework effectively. We will explore the specific mechanics of each force, how to visualize the findings, and how to guide stakeholders toward actionable decisions. The goal is to create a document that informs without overwhelming and persuades without exaggeration.
🛠️ Preparing the Foundation for Analysis
Before opening a slide deck, the groundwork must be solid. A presentation built on shaky data will lose credibility immediately. Preparation involves gathering qualitative and quantitative inputs that validate the forces at play in the client’s specific industry.
- Data Collection: Identify industry reports, competitor filings, and customer sentiment data.
- Stakeholder Interviews: Speak with internal teams to understand perceived threats and opportunities.
- Context Setting: Define the scope. Is this analysis for a new market entry, a product launch, or a general strategic review?
Without this foundation, the presentation becomes theoretical. Clients need to see that the analysis is grounded in reality. Ensure that every claim regarding competitive pressure is backed by evidence.
🔍 Deep Dive into the Five Forces
The core of the presentation rests on the five distinct forces. Each section of the deck should dedicate space to one force, allowing the audience to absorb the complexity before synthesizing the whole picture. Below is a breakdown of how to structure each force within the presentation.
1. 🏭 Threat of New Entrants
This force examines how easy it is for new competitors to enter the market. High barriers to entry protect existing players, while low barriers invite disruption.
When presenting this section, focus on the specific barriers relevant to the client. Consider the following factors:
- Capital Requirements: How much investment is needed to start competing?
- Regulatory Hurdles: Are there licenses or compliance standards to navigate?
- Access to Distribution: Can new players reach customers effectively?
- Brand Loyalty: How difficult is it to sway existing customers?
If the threat is low, emphasize stability. If the threat is high, highlight the need for defensive strategies. Avoid generic statements. Use specific examples from the industry to illustrate the barrier levels.
2. 🤝 Bargaining Power of Suppliers
Suppliers can squeeze profitability by raising prices or reducing quality. Understanding this dynamic is crucial for clients dependent on raw materials, technology, or specialized labor.
Structure this slide to show concentration and substitution potential.
- Supplier Concentration: Are there few suppliers or many?
- Switching Costs: How expensive is it to change vendors?
- Criticality: How essential is the supplier’s input to the final product?
Use a table to summarize supplier power ratings across different categories. This visual aid helps clients quickly grasp where their vulnerability lies.
| Supplier Category | Power Level | Key Risk Factor | Mitigation Strategy |
|---|---|---|---|
| Raw Materials | High | Price Volatility | Long-term contracts |
| Specialized Tech | Medium | Vendor Lock-in | Alternative sourcing |
| Labor | Low | Availability | Automation |
3. 💰 Bargaining Power of Buyers
Customers drive demand, but their power dictates pricing and margins. If buyers have many options or low switching costs, they can dictate terms.
Present this section by analyzing customer segments.
- Volume Concentration: Do a few buyers account for most revenue?
- Price Sensitivity: How much does cost influence the purchase decision?
- Information Availability: Do buyers know the market price better than the seller?
- Product Differentiation: Is the offering unique or commoditized?
Highlight where the client has leverage and where they are exposed. If buyers are powerful, the presentation should pivot to value creation rather than price competition.
4. ⚔️ Rivalry Among Existing Competitors
This is often the most visible force. It involves the intensity of competition within the industry. High rivalry leads to price wars, advertising battles, and innovation races.
Assess the competitive landscape using these criteria:
- Number of Competitors: Is the market fragmented or consolidated?
- Industry Growth: Is the pie growing, or are players fighting for slices?
- Exit Barriers: How hard is it to leave the market if profits fall?
- Diversity of Competitors: Do competitors have different strategies or cultures?
Map out key competitors on a grid. Show where the client sits relative to others in terms of price, quality, and market share. This visual context helps the audience understand their position.
5. 🔄 Threat of Substitute Products
Substitutes are not direct competitors but alternatives that satisfy the same need. They cap the price a company can charge.
Look beyond the immediate industry.
- Performance vs. Price: Do substitutes offer better value?
- Switching Costs: Is it easy for customers to try something else?
- Buyer Propensity: How likely are customers to switch?
For example, a coffee shop faces rivalry from other cafes, but the real threat might be energy drinks or home brewing. Identifying these indirect threats shows deep market understanding.
📈 Synthesizing the Data into a Narrative
Once the five forces are analyzed individually, the presentation must weave them together. A disjointed list of forces does not create strategy. The narrative arc should lead from analysis to implication.
1. Establishing Industry Attractiveness
Combine the findings to rate the overall industry attractiveness. Is this a profitable space to operate in? Use a scoring system to quantify the aggregate pressure from all five forces.
- High Pressure: Margins are under threat. Focus on efficiency or differentiation.
- Medium Pressure: Opportunities exist for targeted improvements.
- Low Pressure: The market is stable. Focus on growth and expansion.
2. Identifying Strategic Levers
For each force that presents a significant risk, identify a strategic lever. This connects the analysis directly to action.
- If Supplier Power is high, consider vertical integration or supplier partnerships.
- If Buyer Power is high, focus on loyalty programs or product customization.
- If Rivalry is intense, explore niche segments or service differentiation.
This section transforms the presentation from a report into a roadmap. Clients need to see the path forward, not just the obstacles.
🎨 Visualizing the Competitive Landscape
Text-heavy slides cause disengagement. Use visual elements to convey complex relationships quickly.
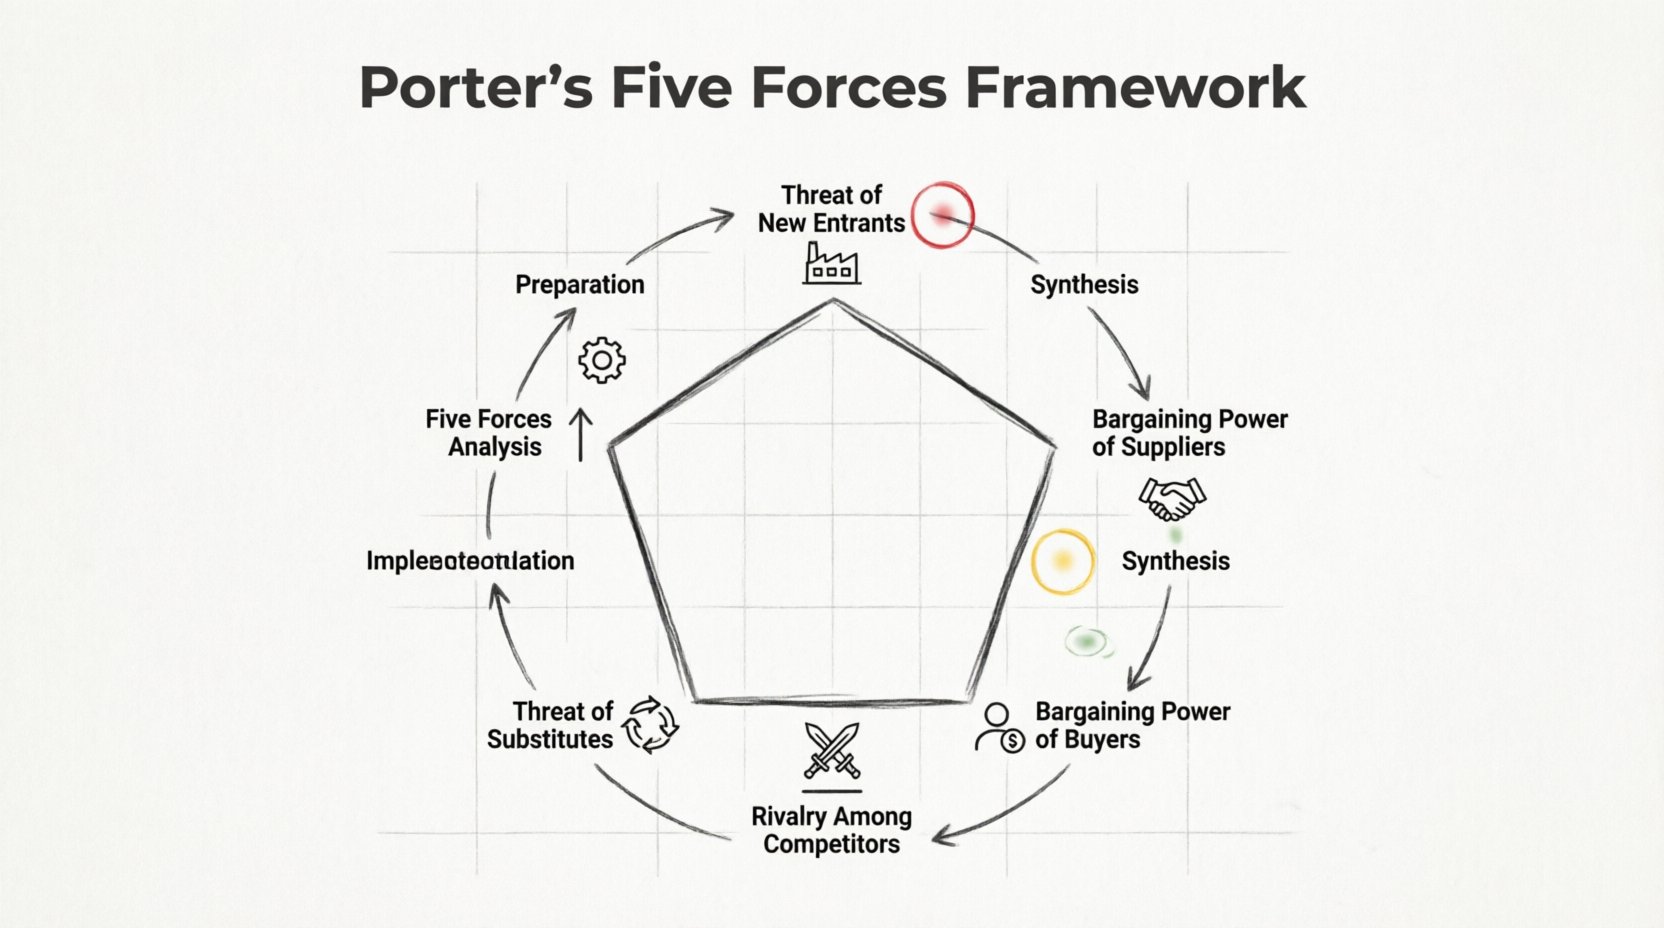
- The Force Diagram: A classic pentagon or star chart can show the intensity of each force at a glance.
- Heat Maps: Use color coding to indicate risk levels (Red for High, Yellow for Medium, Green for Low).
- Flowcharts: Show how a change in one force impacts the others.
- Before/After Scenarios: Illustrate the industry state before and after strategic implementation.
Consistency in design is key. Use the same color palette and iconography throughout the deck. This reinforces the professional quality of the work.
🗣️ Engaging the Audience and Handling Objections
The presentation does not end when the slides stop. The Q&A session is where the analysis is stress-tested. Anticipate questions that challenge the validity of the forces.
Common Objections to Address
- “Is this analysis outdated?” Have a data versioning strategy ready. Show the date of the last market survey.
- “What about external factors like regulation?” Acknowledge macro-environmental factors (PESTLE) as overlays to the Five Forces.
- “Is this applicable to our specific niche?” Show customization of the model to fit the client’s unique position.
Prepare backup slides with deeper data. This allows you to answer detailed questions without cluttering the main presentation. Confidence comes from preparation.
🚀 Moving from Insight to Action
The final section of the presentation must drive momentum. Analysis without execution is merely observation. Outline the immediate next steps required to address the findings.
- Short-term Wins: Quick fixes that reduce immediate pressure.
- Medium-term Initiatives: Projects that take a quarter or two to implement.
- Long-term Strategy: Structural changes that reshape the business model.
Assign ownership for each action item. A presentation that ends with a clear list of responsibilities ensures accountability. It shifts the conversation from “what if” to “who will do it”.
💡 Key Considerations for Modern Contexts
While the framework remains timeless, the context of its application evolves. Digital transformation and globalization have altered some of the traditional forces.
- Digital Disruption: Technology often lowers barriers to entry, increasing the threat of new entrants.
- Global Supply Chains: Supplier power can shift based on geopolitical factors.
- Customer Empowerment: Social media increases buyer power by allowing faster comparison and feedback.
When presenting, explicitly acknowledge these modern shifts. It demonstrates that the analysis is current and relevant to the digital economy.
📝 Final Checklist for Presentation Quality
Before sharing the deck, run through this checklist to ensure clarity and impact.
- Clarity: Is the language simple enough for non-experts?
- Relevance: Does every slide tie back to the client’s business goals?
- Accuracy: Are all data points verified and sourced?
- Flow: Does the story progress logically from problem to solution?
- Visuals: Are charts readable and tables formatted correctly?
Quality control prevents confusion. A clean, focused presentation respects the client’s time and increases the likelihood of adoption.
🔗 Integrating with Other Strategic Tools
Porter’s Five Forces should not exist in isolation. It pairs well with other frameworks to provide a holistic view.
- SWOT Analysis: Use the Five Forces to inform the Opportunities and Threats quadrants.
- BCG Matrix: Analyze where the business fits within the portfolio based on market attractiveness.
- Value Chain: Identify where specific forces impact internal activities like logistics or operations.
Referencing these connections shows a comprehensive strategic approach. It positions the client’s strategy as part of a larger, integrated system.
🌟 Ensuring Long-term Value
The impact of a strategic presentation extends beyond the meeting room. It sets the tone for future planning cycles. Treat the presentation as a living document.
- Review Cycles: Schedule regular updates to the analysis as market conditions change.
- Training: Share the methodology with internal teams so they understand the strategic logic.
- Documentation: Archive the raw data and assumptions for future reference.
This approach ensures that the insights remain useful over time. It builds a culture of strategic thinking within the organization.
📂 Summary of Presentation Architecture
To recap, a successful presentation on this framework follows a specific architecture.
- Introduction: Define the scope and objective.
- Methodology: Explain the framework and data sources.
- Force Analysis: Detail each of the five forces with evidence.
- Synthesis: Combine findings into an overall industry rating.
- Strategy: Propose specific actions based on the analysis.
- Implementation: Define timelines and responsibilities.
Following this structure ensures nothing is missed. It provides a logical path that guides the client from uncertainty to clarity.
🤝 Building Trust Through Transparency
Trust is the currency of consulting. Be transparent about limitations in the data. If a force is hard to measure, admit it and explain how you are estimating it. Honesty builds credibility faster than confidence alone.
- State Assumptions: Clearly list the assumptions made during the analysis.
- Highlight Uncertainty: Acknowledge areas where the market is volatile.
- Invite Feedback: Encourage clients to challenge the findings during the session.
This collaborative approach makes the client a partner in the strategy, rather than a passive recipient.
🏁 Concluding Thoughts on Strategic Delivery
Structuring client presentations around Porter’s Five Forces Framework is an exercise in clarity and rigor. It requires balancing deep analysis with accessible storytelling. When executed well, it empowers clients to navigate complex market dynamics with confidence.
The focus remains on value creation. Every slide should answer the question: “So what?” Why does this force matter to the business? How does this insight change our direction? By maintaining this focus, the presentation becomes a catalyst for meaningful change.
Remember that strategy is a journey. This presentation is a milestone, not the destination. Use the insights gained to inform the next phase of planning. The framework is a tool, and the client is the craftsman. Your role is to sharpen the tool and guide the hand.
With careful preparation, clear visuals, and a logical flow, the presentation will stand as a testament to strategic excellence. It will provide the foundation for decisions that drive sustainable growth and competitive advantage.