


In modern distributed systems, the reliability of a backend service often hinges on how well it handles concurrent requests and shared resources. One of the most persistent and difficult-to-reproduce issues in this domain is the deadlock. A deadlock occurs when two or more processes are unable to proceed because each is waiting for the other to release a resource. This state of permanent blockage can bring an entire system to a halt, causing data inconsistency, service unavailability, and user frustration. To mitigate these risks, architects and engineers must look beyond simple code reviews and adopt a visual approach to system design. Communication diagrams provide a structured way to map interactions, identify potential contention points, and enforce resilience patterns before code is even written.
This guide explores the mechanics of deadlocks within backend environments and demonstrates how communication diagrams can serve as a preventative tool. By visualizing the flow of control and resource acquisition, teams can spot circular dependencies and implement strategies to break them. We will cover the theoretical foundations, practical visualization techniques, and specific architectural patterns that contribute to a resilient system.
Understanding the Mechanics of a Deadlock 🛑
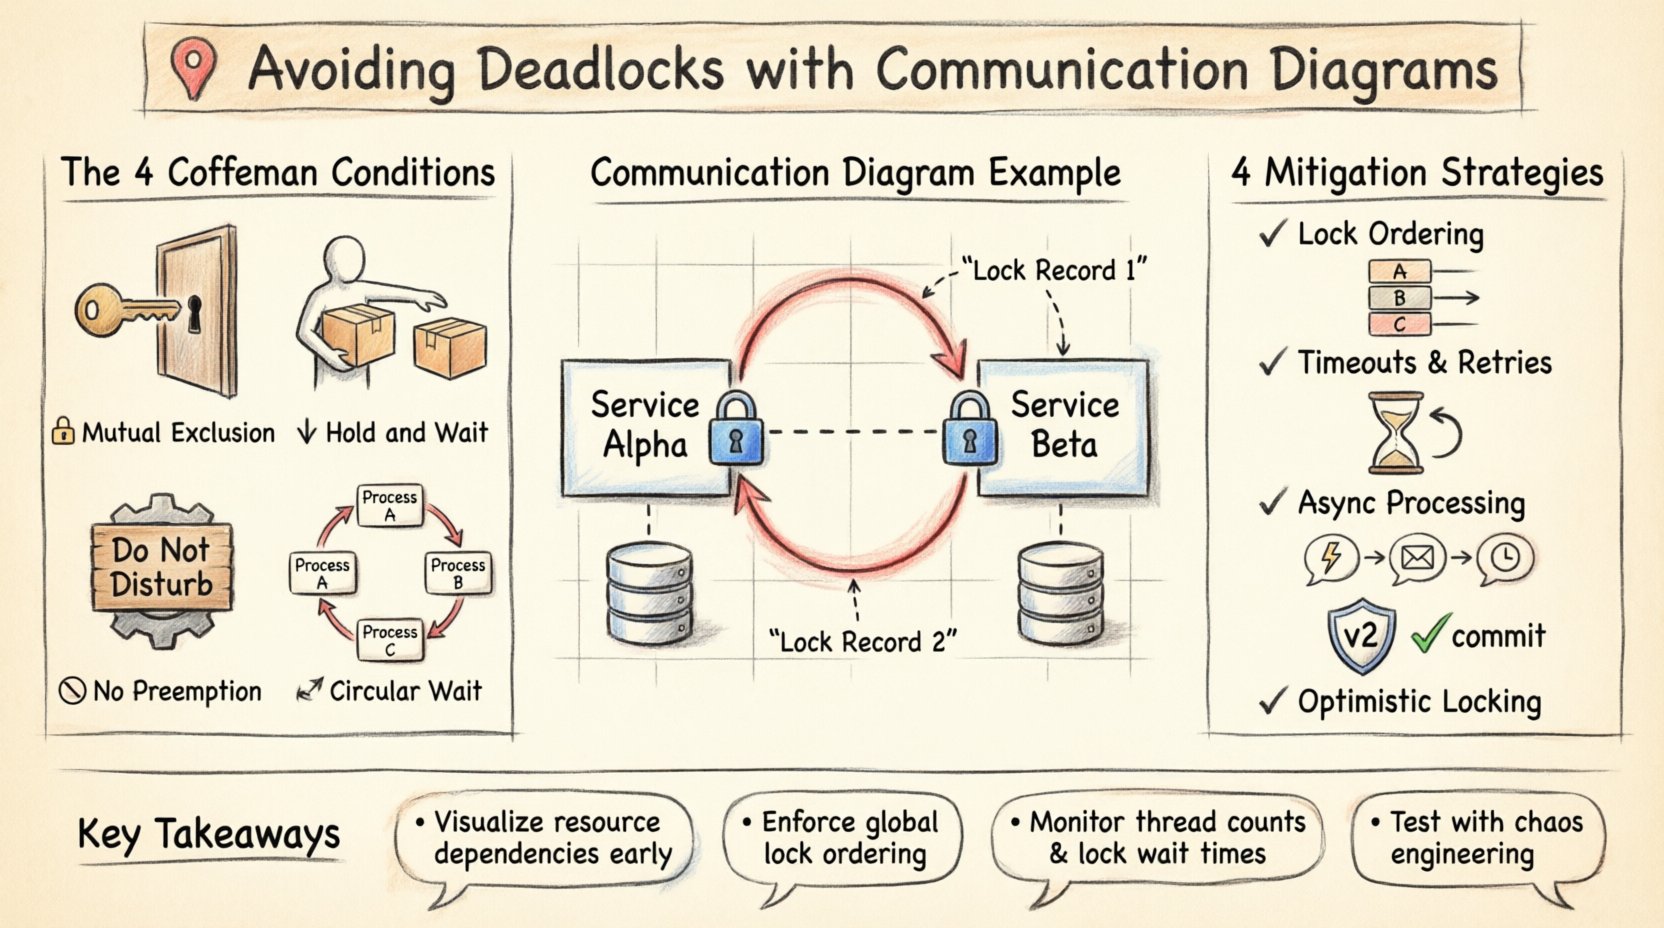
Before addressing prevention, it is necessary to understand the conditions that create a deadlock. In computer science, a deadlock is not a random event; it is the result of a specific set of conditions occurring simultaneously. These are often referred to as the Coffman conditions. For a deadlock to exist, all four of the following conditions must hold true:
- Mutual Exclusion: At least one resource must be held in a non-shareable mode. Only one process can use the resource at any given time.
- Hold and Wait: A process must be holding at least one resource while waiting to acquire additional resources held by other processes.
- No Preemption: Resources cannot be forcibly taken from a process. They must be released voluntarily by the process holding them.
- Circular Wait: A set of processes exists such that P1 is waiting for P2, P2 is waiting for P3, and so on, until Pn is waiting for P1.
In a single-threaded application, deadlock is rare. However, in backend systems handling thousands of concurrent requests, these conditions are easy to satisfy. For instance, if Service A holds a lock on Resource X and waits for Resource Y, while Service B holds Resource Y and waits for Resource X, a circular wait is formed. Without preemption or careful ordering, the system freezes.
The Role of Communication Diagrams 📊
Communication diagrams are a type of Unified Modeling Language (UML) diagram. While sequence diagrams focus on the timeline of messages, communication diagrams emphasize the structural organization of objects and the links between them. In the context of backend resilience, this structural view is crucial. It allows designers to see who is talking to whom and what resources are being exchanged, rather than just the order in which messages arrive.
When designing a microservice architecture or a complex monolithic backend, communication diagrams help answer critical questions:
- Which services require exclusive access to the same database table?
- Are there bidirectional dependencies between two processing units?
- Does a request chain loop back to the originator before completion?
- What is the maximum depth of nested resource locking?
By mapping these interactions early in the design phase, teams can identify potential deadlock scenarios that might be invisible in a purely code-centric review. The diagram acts as a contract for interaction, making implicit assumptions explicit.
Mapping Resource Dependencies 🗺️
To use communication diagrams effectively for deadlock avoidance, the diagram must represent resources, not just data flow. Standard interaction diagrams often show service-to-service calls. However, to analyze locks, we must annotate the links with resource identifiers. This requires a slightly higher level of abstraction where nodes represent processes or threads, and links represent shared resources or communication channels.
Steps to Create a Deadlock-Aware Diagram
- Identify Critical Resources: List all shared states, such as database rows, file handles, or memory buffers. Assign them unique identifiers.
- Define Ownership: Determine which service or thread currently controls which resource. Mark this on the diagram.
- Trace Acquisition Paths: Draw arrows indicating the request for a resource. Label the arrow with the resource name.
- Highlight Wait States: Use specific notation to show when a process is blocked waiting for a resource.
- Analyze Cycles: Look for closed loops in the diagram where Process A waits for Process B, which waits for Process A.
Identifying Circular Wait Patterns 🔁
The most dangerous pattern in system design is the circular dependency. In a communication diagram, this appears as a closed loop of interactions. Consider a scenario involving two services, Service Alpha and Service Beta.
- Service Alpha initiates a transaction and locks Record 1.
- Service Alpha requests a lock on Record 2 from Service Beta.
- Service Beta already holds a lock on Record 2 but needs to update Record 1, which is held by Alpha.
In a visual representation, this loop is immediately apparent. The diagram shows Alpha pointing to Beta, and Beta pointing back to Alpha, both demanding the resource held by the other. Without a diagram, this logic might only be found during a production outage or a complex stress test.
Common Scenarios Leading to Circularity
- Transaction Propagation: When a distributed transaction requires multiple services to commit in a specific order, but the order is not enforced.
- Nested Calls: A function calls another function that eventually calls the original function, creating a recursive lock chain.
- Shared Cache: Multiple services attempting to update the same cached entry simultaneously without a distributed lock mechanism.
- Database Foreign Keys: Updates on related tables that require locks on both tables, where the order of updates differs between services.
Strategic Mitigation Techniques 🛠️
Once a communication diagram reveals a potential deadlock, specific architectural changes are required. There is no single solution that fits every system, but several proven strategies exist to break the Coffman conditions.
1. Lock Ordering
This is the most effective method for preventing circular wait. The system must enforce a global ordering of resources. If every process requests resources in the same order (e.g., Resource A before Resource B), a cycle cannot form. In a communication diagram, this means ensuring that all links requesting Resource X are established before any link requests Resource Y.
2. Timeouts and Retries
Even with ordering, contention is possible. Implementing a timeout on resource acquisition ensures that a process does not wait indefinitely. If a lock cannot be acquired within a specified duration, the process releases its current resources and retries. This prevents the system from freezing permanently, though it may introduce latency.
3. Asynchronous Processing
Switching from synchronous requests to asynchronous event-driven architectures can reduce contention. Instead of waiting for a lock to release, a service publishes an event and continues processing. When the resource becomes available, a consumer handles the update. This decouples the timing of resource usage.
4. Optimistic Locking
Instead of acquiring a lock before reading or modifying data, the system checks for conflicts at the time of commit. If another process has modified the data since the read, the transaction fails and must be retried. This reduces the holding time of locks, minimizing the window for deadlock.
Comparison of Prevention Strategies
| Strategy | Prevents Condition | Complexity | Performance Impact |
|---|---|---|---|
| Lock Ordering | Circular Wait | High | Low |
| Timeouts | Hold and Wait (Indirectly) | Low | Medium (Retries) |
| Optimistic Locking | Mutual Exclusion (Long term) | Medium | Variable |
| Asynchronous Flow | Hold and Wait | High | Low |
Implementation Steps for Diagram-Based Analysis
To integrate this approach into your development workflow, follow these steps:
- Conduct a Design Review: Before writing code, create the communication diagram for new features. Focus on data access paths.
- Annotate Resource Usage: Mark every database write, cache update, or file operation on the diagram.
- Run a Cycle Detection Algorithm: If using automated tools, apply graph algorithms to detect cycles in the dependency graph derived from the diagram.
- Refactor for Independence: If a cycle is found, refactor the code to break the dependency. This might involve introducing a mediator service or changing the data model.
- Validate with Load Testing: Simulate high concurrency to ensure that the deadlock patterns do not manifest under stress.
Monitoring and Observability 🧪
Even with careful design, runtime conditions can change. Monitoring tools should be configured to detect signs of deadlock. Key metrics include:
- Thread Count: A sudden spike in blocked threads may indicate resource contention.
- Lock Wait Time: If the average time to acquire a lock increases significantly, contention is rising.
- Transaction Rollbacks: A high rate of rollbacks due to timeout or conflict suggests locking strategies are too aggressive.
- Deadlock Detection Logs: Some database engines and operating systems log deadlock events. These logs should be integrated into the central logging system.
Case Study: Service Interaction Flow
Consider a generic e-commerce backend handling orders and inventory. Service A handles Orders, and Service B handles Inventory.
Scenario: Service A creates an order and locks the Order ID. It then calls Service B to reserve inventory. Service B locks the Inventory ID. To update the Order status, Service B needs to send a callback to Service A, which requires locking the Order ID again.
The Deadlock: If Service A holds the Order ID and waits for Service B to release the Inventory ID, but Service B cannot complete without Service A releasing the Order ID (via the callback), a deadlock occurs. This is a nested lock scenario.
The Fix: Using a communication diagram, this loop is visible. The fix involves breaking the dependency. Service B should update the inventory asynchronously or use a separate transaction ID that does not require re-locking the Order ID held by Service A. The diagram would then show a one-way flow from A to B, with no return path requiring the original lock.
Distributed Locking Considerations
In distributed environments, locks are often managed by external services rather than the application itself. This introduces network latency and the risk of partial failures. Communication diagrams must account for the network link as a potential point of failure. If the link between Service A and the Lock Manager fails, Service A might think it holds the lock while another service does.
To address this, the diagram should include a “Lock Manager” node. Interactions with this node must be idempotent and time-bound. The design must ensure that if a service crashes, the lock is automatically released after a lease time expires. This prevents the “Hold and Wait” condition from persisting indefinitely.
Testing for Resilience
Design diagrams are theoretical. Real-world testing is required to validate resilience. This includes:
- Chaos Engineering: Intentionally introduce latency or failures in the network links shown in the diagram to see if the system recovers or deadlocks.
- Stress Testing: Run concurrent requests that match the patterns identified in the diagram to verify lock ordering works under load.
- Static Analysis: Use tools to analyze the codebase for potential lock ordering violations that match the diagram logic.
Conclusion
Avoiding deadlocks is not merely a coding exercise; it is a system design challenge. By utilizing communication diagrams, teams can visualize the complex web of resource dependencies that lead to system freezes. This approach shifts the focus from reactive debugging to proactive prevention. Understanding the four conditions of a deadlock, mapping resource acquisition paths, and enforcing strict ordering or asynchronous patterns are essential steps in building resilient backend infrastructure. While no system is immune to concurrency issues, a structured visual approach significantly reduces the risk and complexity of managing shared resources. Consistent application of these principles ensures that services remain responsive and data remains consistent, even under high load and failure conditions.