In complex systems, efficiency is not always apparent until a slowdown occurs. When processes stall, data lags, or throughput drops, the underlying issue often lies in the movement of information rather than the storage or computation itself. Data flow analysis provides a structured method to visualize how information moves through a system, making it easier to spot where friction arises. By mapping these flows, teams can pinpoint exact locations where capacity is exceeded or where unnecessary delays accumulate. 🧭
This approach requires a clear understanding of the system architecture without relying on proprietary tools. The goal is to establish a logical framework that reveals inefficiencies. Whether managing a software pipeline, a manufacturing line, or an administrative workflow, the principles remain consistent. Identifying these constraints allows for targeted interventions that yield measurable improvements in speed and reliability. ⚙️
Understanding the Foundations of Data Flow Diagrams 🗺️
Before locating a bottleneck, one must understand the map. A Data Flow Diagram (DFD) is a graphical representation of the flow of data through an information system. It focuses on where data comes from, where it goes, and how it changes. Unlike flowcharts that depict control logic, DFDs emphasize the movement and transformation of data elements.
There are four primary components within a standard DFD:
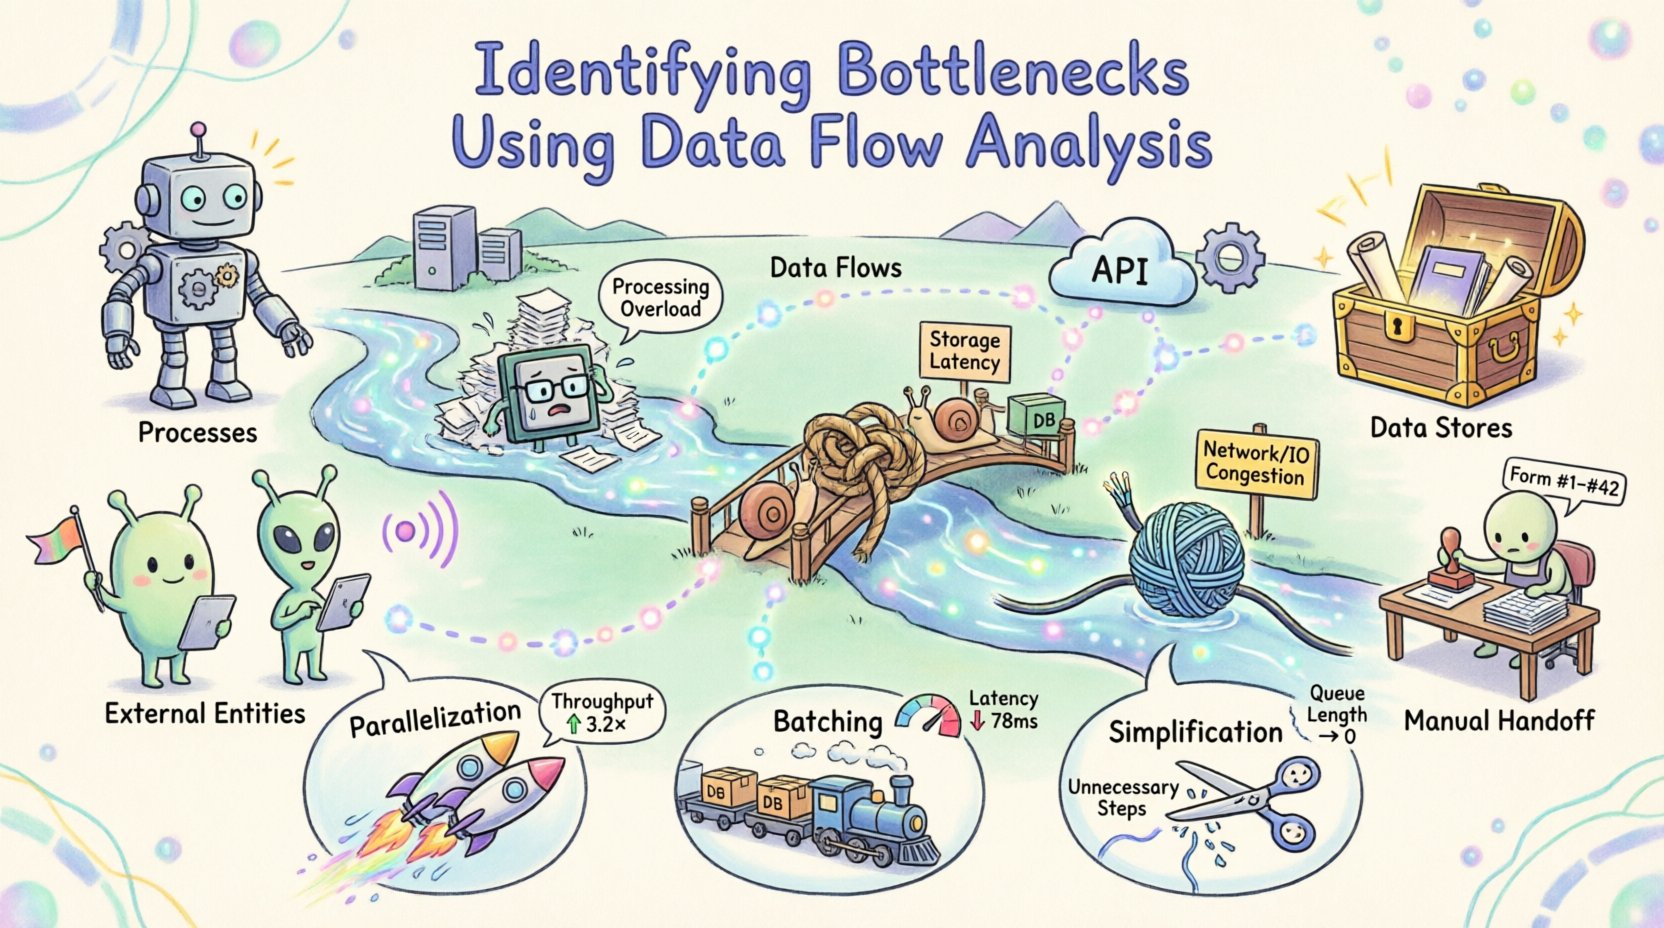
- Processes: Transformations that convert input data into output data. These are often represented as circles or rounded rectangles.
- Data Stores: Locations where data is held for later use, such as databases or files.
- External Entities: Sources or destinations outside the system boundary, such as users or other systems.
- Data Flows: The paths along which data moves between the components.
Creating a high-level diagram establishes the scope. A lower-level diagram then drills down into specific processes. This hierarchy allows analysts to examine the system at different granularities. If a delay occurs at the macro level, zooming in reveals the specific process or transfer causing the lag. 🔍
The Anatomy of a System Bottleneck 🚦
A bottleneck is any point in a system where the flow of data is restricted, causing a backlog or delay. In the context of data flow analysis, bottlenecks manifest in several distinct ways. Recognizing the type of constraint is the first step toward resolution.
| Bottleneck Type |
Description |
Typical Symptoms |
| Processing |
Computation or logic takes longer than the incoming data stream can support. |
Queues build up before the process; high CPU or memory usage spikes. |
| Storage |
Reading or writing data to a database or file system is slow. |
Latency increases during data retrieval; transaction times vary wildly. |
| Network/IO |
Transfer speed between components is limited by bandwidth or latency. |
Timeouts occur; large data transfers pause frequently. |
| Human |
Manual intervention is required where automation should exist. |
Tasks wait for approval; errors occur due to fatigue or complexity. |
Understanding these categories helps in prioritizing fixes. A network limitation might require infrastructure changes, while a processing limit might need algorithmic optimization. Without this distinction, efforts may be misdirected toward areas that do not constrain the system. 🛠️
Methodology for Identification 🔎
Identifying bottlenecks is not a one-time event but a systematic investigation. The following steps outline a robust approach to analyzing data flows and locating constraints.
1. Map the Current State
Begin by documenting the existing architecture. Do not rely on memory or assumptions. Interview stakeholders and review documentation to capture the actual flow of information. Create a Level 0 diagram that shows the system boundary and external interactions. Then, create Level 1 diagrams that break down the major processes. Ensure that every data flow has a defined input and output.
2. Define Metrics for Measurement
Visual maps are qualitative. To find bottlenecks, you need quantitative data. Select key performance indicators (KPIs) for each process and data flow. Relevant metrics include:
- Throughput: The amount of data processed per unit of time.
- Latency: The time taken for data to travel from source to destination.
- Utilization: The percentage of time a resource is active.
- Queue Length: The number of items waiting for processing.
Collecting this data over a representative period reveals patterns. A process might look fast on average but show significant spikes during peak loads. These spikes are often where the bottleneck hides. 📉
3. Analyze Data Transitions
Examine the connections between processes. Look for data flows that branch into multiple paths or merge from multiple sources. Merging points often create contention. If three streams feed into one processor, that processor must handle the combined load. If the capacity is not scaled accordingly, a backlog forms.
Similarly, check for loops. Data that cycles back through a process repeatedly indicates rework or error handling. Excessive looping consumes resources without adding value. Trace these loops to determine if they are necessary or the result of poor design. 🔄
4. Correlate with Resource Usage
Map the data flow metrics against system resources. High data flow volume should correlate with high resource usage. If a specific data flow shows high latency but low resource usage elsewhere, the issue may be specific to that path. Conversely, if all processes slow down simultaneously, the issue might be systemic, such as a shared database lock or network congestion.
Use monitoring tools to track resource consumption alongside the flow. This correlation helps distinguish between a logical bottleneck (poor design) and a physical bottleneck (hardware limits). ⚖️
Quantifying the Impact of Constraints 📊
Once a potential bottleneck is identified, its impact must be quantified. This step ensures that resources are allocated to the most critical issues. Not all delays are equal. A delay in the user interface might be more damaging than a delay in a background report generation.
Calculate the cost of delay. This involves estimating the time lost per transaction and multiplying it by the volume of transactions. For example, if a process takes an extra 100 milliseconds and handles 10,000 transactions per hour, the total lost time is significant. If this delay affects user experience, the business cost is even higher.
Consider the ripple effect. A delay at the start of a pipeline can propagate downstream. If the first step is delayed, all subsequent steps are pushed back. This amplifies the total impact. Identifying the root cause prevents treating symptoms. Fixing the first step often resolves the downstream delays automatically. 🌊
Strategies for Optimization 🛠️
With the bottlenecks identified and quantified, the focus shifts to optimization. The strategy depends on the nature of the constraint. There are three primary levers to pull: parallelization, batching, and simplification.
Parallelization
If a process is limited by computation, splitting the work across multiple resources can increase throughput. This is often applicable to independent tasks. If the data flow allows for splitting, distribute the load. Ensure that the synchronization overhead does not negate the gains. Parallelization works best when tasks do not depend on the immediate output of one another. 🚀
Batching
If the constraint is related to I/O or network latency, processing data in batches can be more efficient than processing individual items. This reduces the overhead of opening and closing connections. However, batching introduces latency for individual items. Balance the throughput gain against the acceptable delay for the end user. 📦
Simplification
Often, the most effective optimization is removing unnecessary steps. Review the data flow for redundant transformations. If data is converted from one format to another and then back again, the intermediate step may be removed. Simplify the logic to reduce processing time. Every step added to a flow introduces potential points of failure and delay. ✂️
Continuous Monitoring and Iteration 🔄
Optimization is not a final destination. Systems evolve, and new bottlenecks emerge as traffic patterns change. Once the initial analysis is complete and improvements are implemented, the cycle begins again. Establish a routine for reviewing data flows.
Set up alerts for the metrics defined earlier. If throughput drops or latency spikes, trigger an investigation. Maintain the documentation of the DFDs. As changes are made to the system, update the diagrams. Outdated maps lead to incorrect assumptions and wasted effort. 📝
Encourage a culture of continuous improvement. Teams should be empowered to report inefficiencies they encounter in their daily work. Frontline users often see bottlenecks that high-level metrics miss. Their feedback is invaluable for refining the analysis. 👥
Case Study: A Generic Workflow Optimization 🏭
Consider a scenario where an order processing system experienced delays during peak hours. Initial analysis showed that the order validation step was taking too long. The DFD revealed that validation required three separate checks against different external systems.
By analyzing the flow, the team realized these checks happened sequentially. Changing the design to perform these checks in parallel reduced the total validation time by 60%. The data flow diagram was updated to reflect this new structure. Monitoring confirmed that the backlog cleared faster, and the system handled peak loads without intervention. This example demonstrates how structural changes to the flow yield immediate results. ✅
Best Practices for Sustainable Efficiency 🌱
To maintain a healthy system, adhere to these guidelines:
- Keep Diagrams Current: An outdated map is worse than no map.
- Focus on Flow, Not Just Function: Ensure data moves smoothly, not just that features work.
- Measure Everything: If it is not measured, it cannot be improved.
- Review Regularly: Schedule periodic audits of the data architecture.
- Document Assumptions: Record why certain flows were designed a specific way to aid future troubleshooting.
By treating data flow as a critical asset, organizations can ensure that their systems remain responsive and reliable. The process of identifying bottlenecks is not about finding faults, but about understanding the system deeply. This understanding leads to resilience and performance. 🛡️
Final Thoughts on Data Flow Integrity 🧩
Efficiency in any system relies on the smooth movement of information. When data encounters resistance, the entire operation slows. Data flow analysis offers a clear lens to see where this resistance occurs. By mapping, measuring, and modifying the flow, teams can remove friction and enhance performance.
The techniques described here provide a framework for sustainable optimization. They require discipline and attention to detail, but the payoff is a system that performs consistently under pressure. As data volumes grow, the ability to manage flow becomes increasingly critical. Mastering this discipline ensures longevity and reliability for the architecture. 🏆