


In the modern landscape of software development, a significant disconnect often exists between business objectives and technical implementation. Business leaders, product managers, and clients possess a deep understanding of the market, user needs, and operational goals. Conversely, development teams understand the logic, data structures, and system constraints required to build a solution. Without a shared visual language, these two groups can drift apart, leading to scope creep, misunderstood requirements, and delayed timelines. This is where the communication diagram becomes an essential tool. It serves as a universal translator, turning abstract technical processes into a visual narrative that everyone can understand.
This guide explores the utility of communication diagrams specifically for non-technical stakeholders. By focusing on the interactions between system components rather than the underlying code, these diagrams provide clarity. They allow stakeholders to validate the flow of information and logic before a single line of code is written. This document will break down the anatomy of these diagrams, explain how to interpret them, and outline best practices for using them in collaborative environments.
🧩 Understanding the Communication Diagram
A communication diagram, often referred to as a collaboration diagram in certain standards, is a type of interaction diagram used in software engineering. While it might sound technical, its primary purpose is human communication. It depicts how objects within a system interact with each other to achieve a specific goal. Unlike a flowchart, which focuses on decision points and sequential steps, a communication diagram emphasizes the structural relationships and the messages passed between entities.
For a stakeholder who does not write code, this distinction is vital. You do not need to know the syntax of a programming language to understand that Object A sends a request to Object B. You only need to understand that Object A represents a specific business entity (like a Customer) and Object B represents a process (like Payment Processing). The diagram maps the journey of a request through the system.
Key Distinctions from Other Models
- Sequence Diagrams: These focus heavily on time and order. The vertical axis represents time. Communication diagrams de-emphasize time and focus on the connections between objects.
- Class Diagrams: These show static structure (attributes and methods). Communication diagrams show dynamic behavior (what happens when something occurs).
- Flowcharts: These show logic flow. Communication diagrams show object interaction.
By choosing the communication diagram, you prioritize the relationships between parts of the system over the strict timing of events. This makes it easier for stakeholders to visualize the ecosystem of the software without getting bogged down in the millisecond-level timing of server responses.
🔍 The Anatomy of the Diagram: Decoding the Symbols
To read a communication diagram effectively, one must understand the symbols used to construct it. These symbols are standardized, meaning a diagram created by one team can be understood by another. For non-technical stakeholders, memorizing the symbols is less important than understanding what they represent in a business context.
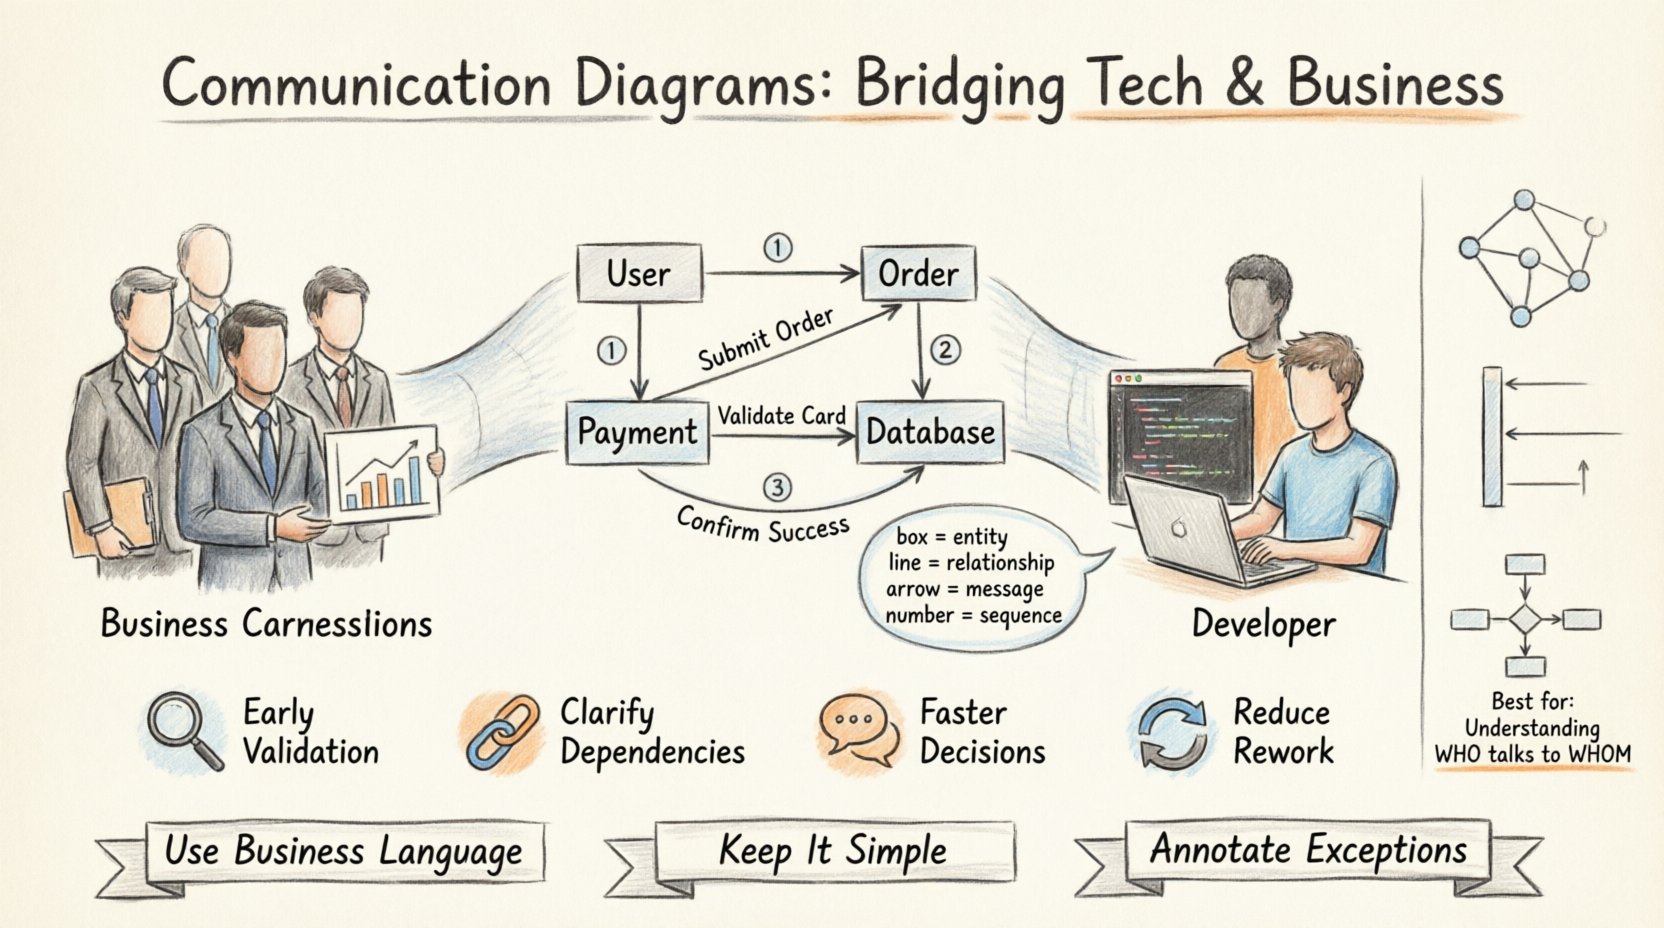
1. Objects (The Boxes)
Boxes in the diagram represent objects. In a technical sense, an object is an instance of a class. In a business sense, an object represents a tangible or intangible entity within the system. When you see a box labeled “User,” it represents the person logging in. When you see “Database,” it represents the storage location for data.
- Visual Cue: A rectangle, often with the name of the object at the top.
- Business Meaning: A role, a resource, or a system module.
- Stakeholder Focus: Does this object exist in your business process? If you see a box for “External API,” you need to understand if that is a third-party service you rely on.
2. Links (The Lines)
Lines connect the objects. These represent the relationships or associations between the entities. If the User object is connected to the Order object, it implies a relationship where the User can create an Order. These links are structural; they define who can talk to whom.
- Visual Cue: A solid line connecting two boxes.
- Business Meaning: A direct relationship or access permission.
- Stakeholder Focus: Identify if a process requires a connection to an entity that should be secure or restricted.
3. Messages (The Arrows)
Arrows indicate the flow of information. This is the most dynamic part of the diagram. An arrow from Object A to Object B signifies that Object A is requesting something from Object B. The label on the arrow describes the action, such as “Submit Order” or “Validate Credit Card.”
- Visual Cue: A line with an arrowhead pointing to the receiver.
- Business Meaning: A request, a command, or a data transfer.
- Stakeholder Focus: Does this action align with the business rule? For example, does the system ask for confirmation before sending an email?
4. Message Numbers (The Sequence)
Often, arrows are numbered (1, 2, 3…). This indicates the order of operations. Message 1 happens before Message 2. This allows stakeholders to trace the path of a transaction from start to finish.
- Visual Cue: A small number near the arrow.
- Business Meaning: Step in the process.
- Stakeholder Focus: If the process is complex, does the order make logical sense?
🤝 Why Non-Technical Stakeholders Need This
Why should a Project Manager or a Client invest time in reviewing these diagrams? The answer lies in risk reduction and alignment. Software development is expensive. Changing a requirement after the code is written costs significantly more than changing it during the design phase. Communication diagrams facilitate early detection of issues.
1. Early Validation of Logic
Stakeholders can verify that the system handles edge cases correctly. For instance, if a user cancels an order, does the diagram show the cancellation message going to the Inventory object and the Payment object? If the diagram only shows the Inventory object, the stakeholder can immediately flag that the refund process is missing.
2. Clarifying Dependencies
Businesses often rely on external services. A communication diagram makes dependencies visible. If the “Login” object relies on the “Identity Provider” object, the stakeholder knows that a change in the Identity Provider could break the Login system. This is crucial for understanding maintenance and uptime requirements.
3. Facilitating Discussion
Diagrams provide a focal point for meetings. Instead of saying “What happens when the user clicks this button?” the team can point to a specific arrow on the diagram. This reduces ambiguity and speeds up decision-making.
📖 Step-by-Step Guide to Reading a Diagram
Reading a communication diagram requires a systematic approach. Do not try to absorb the whole image at once. Break it down into the flow of a single transaction. Follow the numbered messages to trace the story.
- Identify the Trigger: Look for the starting point. Usually, this is an external actor, such as a “User” or an “External System.” This is where the process begins.
- Follow the Arrows: Trace the path of the numbered arrows. Move from one object to the next, reading the message label.
- Check the Return: Look for dashed arrows returning to the sender. These represent the response. Does the system return a success message? Does it return an error code?
- Verify the End State: Ensure the diagram shows where the process concludes. Does the data get saved? Does the user get a notification?
📊 Comparison of Diagram Types
While communication diagrams are powerful, they are not the only tool available. Understanding when to use them versus other types of diagrams is key to effective communication.
| Diagram Type | Primary Focus | Best For Stakeholders Who… |
|---|---|---|
| Communication Diagram | Object interactions and relationships | Need to understand who talks to whom and the context of actions. |
| Sequence Diagram | Timing and order of messages | Need to understand the strict chronological order of events. |
| Use Case Diagram | Functional requirements | Need to understand the high-level goals of the user. |
| Flowchart | Decision logic and process flow | Need to understand conditional logic (If/Then/Else). |
For non-technical stakeholders, the Communication Diagram often strikes the best balance. It is less abstract than a Sequence Diagram because it groups objects spatially based on relationships, making it easier to see the “network” of the system.
⚠️ Common Misunderstandings to Avoid
Even with a clear diagram, misunderstandings can occur. Stakeholders and developers must be aware of common pitfalls to ensure the diagram serves its purpose.
- Confusing Structure with Behavior: Stakeholders might look at the diagram and think it shows the code structure. It does not. It shows behavior. The lines are connections, not variable declarations.
- Assuming All Paths are Covered: A diagram often shows the “Happy Path” (the ideal scenario). It may not show what happens if a server crashes or a user enters invalid data. Stakeholders should ask about exception flows specifically.
- Over-Interpreting Timing: As mentioned, this diagram does not focus on timing. Just because Message A is before Message B does not necessarily mean they are instantaneous. The delay might be seconds, minutes, or hours.
- Ignoring External Actors: Sometimes diagrams focus only on internal objects. Stakeholders must ensure that external systems (like payment gateways or email servers) are included if they are part of the critical path.
🛠️ Best Practices for Collaboration
To maximize the value of communication diagrams, the team must adopt specific practices during creation and review.
1. Use Business Language
Labels on the arrows and boxes should use terminology familiar to the business. Instead of “processUserInput()”, use “Submit Form”. Instead of “validateDTO()”, use “Check Data Validity”. This reduces the cognitive load for non-technical reviewers.
2. Iterate Quickly
Do not create a perfect diagram on the first try. Create a draft, present it to stakeholders, gather feedback, and refine it. The diagram is a living document during the design phase.
3. Keep It Simple
A diagram with too many objects becomes a “spaghetti diagram” that is impossible to read. If a process is complex, break it into smaller diagrams. For example, have one diagram for “User Registration” and another for “Order Processing”.
4. Annotate Exceptions
Use notes or separate diagrams to highlight what happens when things go wrong. A stakeholder needs to know that if the payment fails, the system locks the order. This should be visible in the documentation.
🔄 Integrating Feedback Loops
The review process is not a one-time event. As the project progresses, the requirements may evolve. If a stakeholder requests a new feature, the communication diagram must be updated to reflect how this new feature interacts with existing objects.
- Change Management: If the “Shipping” object changes its logic, the diagram should be updated to show the new messages it receives.
- <**>Impact Analysis: Before making changes, review the diagram to see which objects are connected. This helps identify side effects. If you change the “Login” object, does it break the “Profile” object?
💡 Strategic Value in Software Development
Ultimately, the value of communication diagrams extends beyond technical documentation. They are a strategic asset for organizational alignment. By visualizing the system, stakeholders gain confidence in the development process. They feel involved in the architecture, not just the final product.
This involvement reduces the “black box” perception of software development. When stakeholders understand how the pieces fit together, they can make more informed decisions about priorities and trade-offs. They understand why a feature might take longer to build if it requires integrating with multiple external systems, as shown by the web of connections in the diagram.
🚀 Moving Forward
Adopting communication diagrams as a standard practice requires a shift in mindset. It requires developers to think in terms of business interactions and stakeholders to think in terms of system flows. However, the return on investment is substantial. It reduces rework, minimizes miscommunication, and ensures that the final software meets the actual needs of the business.
Start by introducing these diagrams in your next design review. Keep the language simple, focus on the relationships, and invite questions. With practice, these diagrams will become a natural part of your workflow, bridging the gap between vision and execution.