


Introduction to State Diagrams
A state diagram (also known as a state machine diagram or state chart) is a UML diagram used to model the dynamic nature of a system. It consists of states, transitions, events, and activities, illustrating how an object responds to various events by changing from one state to another.
State diagrams are especially important in modeling the behavior of interfaces, classes, or collaborations. They emphasize the event-ordered behavior of an object, which is particularly useful in modeling reactive systems where the behavior depends not only on current inputs but also on the object’s preceding state.

Key Concepts of State Machines
What is a State Machine?
A state machine is a behavior that specifies the sequences of states an object goes through during its lifetime in response to events, together with its responses to those events.
Core Elements
State: A condition or situation during the life of an object during which it satisfies some condition, performs some activity, or waits for some event. A state represents an abstraction of the attribute values and links of an object.
Event: The specification of a significant occurrence that has a location in time and space. In state machines, an event is an occurrence of a stimulus that can trigger a state transition. Events can be:
-
Signal events – corresponding to the arrival of an asynchronous message
-
Call events – corresponding to a procedural call to an operation
-
Time events – occurring after a specified time has elapsed
-
Change events – occurring whenever a specified condition is met
Transition: A relationship between two states indicating that an object in the first state will perform certain actions and enter the second state when a specified event occurs and specified conditions are satisfied. Transitions are rendered as solid directed lines.
Guard Condition: A boolean expression evaluated after the trigger event occurs. Multiple transitions can exist from the same source state with the same event trigger, as long as guard conditions don’t overlap.
Action: An executable atomic computation that results in a change in the state of the model or the return of a value. Actions are associated with transitions and are not interruptible.
Activity: An ongoing non-atomic execution within a state machine. Activities are associated with states and may run to completion or continue indefinitely.
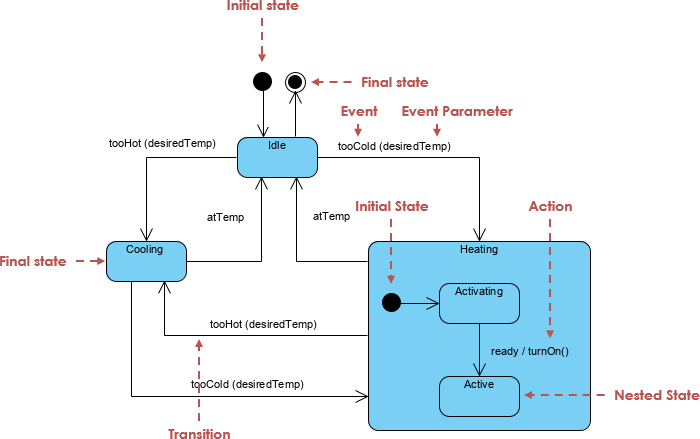
Graphical Notation
-
State: Rendered as a rectangle with rounded corners
-
Initial State: Indicated with a solid circle (initial pseudo-state)
-
Final State: Shown as concentric circles
-
Transition: Rendered as a solid directed line with an arrow
Activity Diagrams vs. State Machines
Understanding the distinction between activity diagrams and state machines is crucial for proper modeling:
Activity Diagrams
-
Capture high-level activities and workflow
-
Focus on the flow of data within a system
-
Represent concurrency and coordination
-
Vertices represent the carrying out of activities
-
Edges represent transitions on completion of activities
![]()
State Machines
-
Focus on event-ordered behavior of objects
-
Vertices represent states of an object in a class
-
Edges represent occurrences of events
-
Model the lifecycle of a single abstraction (object or system)
-
Emphasize how objects respond to events based on their current state
![]()
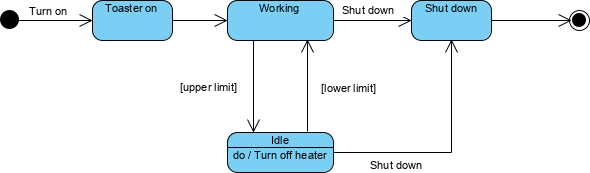
Practical Example: State Machine for a Toaster
Basic Toaster State Machine
Let’s model the process of making toast. The basic workflow includes:
-
Turn on the toaster
-
Put in the bread
-
Wait for several minutes to bake it
Refining the State Machine: Preventing Burnt Toast
To prevent burning the bread, we need to implement temperature control with upper and lower limits:
-
A thermometer measures the heater temperature
-
When the upper temperature limit is reached, the heater enters an idle state
-
The heater remains idle until the temperature decreases to the lower limit
-
Then the working state is re-entered
This creates a feedback loop that maintains temperature within safe bounds.
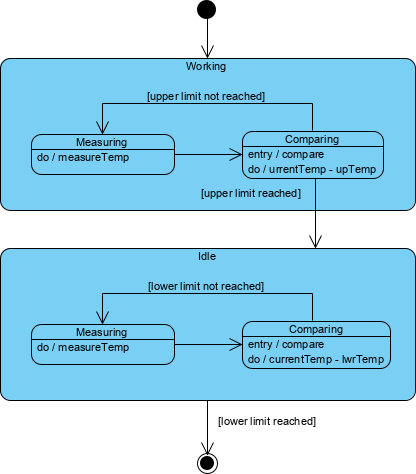
Using Super-States and Sub-States
We can organize the state machine hierarchically by:
-
Partitioning working and idle as super-states
-
Encapsulating detailed states inside each super-state
-
Creating transitions between the super-states
Working State: Compares current temperature with the upper-temperature limit. If reached, transitions to idle state.
Idle State: Compares current temperature with the lower-temperature limit. If temperature falls below, transitions back to working state.
Both sub-states perform similar measurement and comparison activities but differ in their temperature comparison logic.
Concurrent Sub-States and Regions
Concurrent sub-states are independent and can complete at different times. Each sub-state is separated from others by a dashed line, representing parallel execution paths within a composite state.
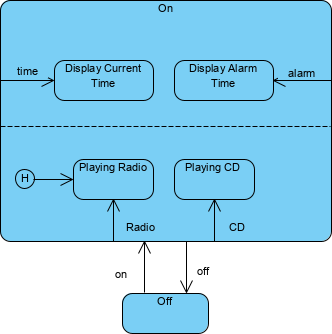
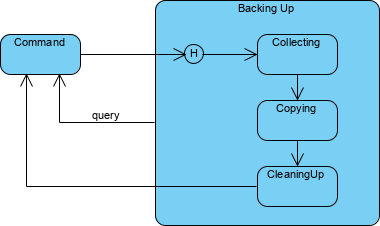
History States
History states allow the state machine to re-enter the last sub-state that was active prior to leaving the composite state. Without a history state, when a transition enters a composite state, the nested state machine starts over at the initial state.
A history state is indicated by a circle with an H inside it, enabling the state machine to resume from where it left off rather than restarting.
Associating State Diagrams with Classes
State machines can be associated with classes, which is especially useful when:
-
Modeling event-driven systems
-
Modeling the lifetime of a class
-
Showing the state of an object at a given time
For example, an instance of a Phone class (object c) can be shown in the state “WaitingForAnswer,” a named state defined in the state machine for the Phone class.

Entry and Exit Actions
States can have entry and exit actions that execute automatically:
-
Entry Action: Executed on entry into a state (notation:
entry / action) -
Exit Action: Executed on exit from a state (notation:
exit / action)
These actions must be true for every entry/exit occurrence. If conditional behavior is needed, use actions on individual transition arcs instead.
Refining Reactive Systems with AI
Building state diagrams for reactive systems requires constant refinement—from basic lifecycles to complex logic involving super-states and guard conditions. Modern AI tools help automate this evolution, ensuring state machines are robust and logically sound.
AI Modeling Tools
VP Desktop: Seamlessly integrate AI-generated state logic into professional class models and architectural designs.
AI Chatbot: Iteratively refine toaster-like logic by chatting with the AI to add new states, guards, and transitions through natural language commands.
Key Benefits
🔄 Iterative Refinement: AI automatically identifies states and transitions from system requirements
⏱️ Time-Saving: Generate diagrams in one click, within seconds
🎯 Accuracy: Ensures proper UML notation and semantic correctness
AI-Powered State Diagram Generation
Visual Paradigm’s AI simplifies state diagram generation by converting natural language descriptions into standards-compliant UML models in seconds. You can describe an object’s lifecycle—such as an online order or a support ticket—and the AI automatically identifies:
-
Necessary states
-
Transitions
-
Triggers
-
Guard conditions
Key Features for State Diagrams
-
Natural Language to Diagram: Instantly generate complete UML State Machine Diagrams from simple text prompts
-
Conversational Refinement: Use a chatbot interface to iteratively modify diagrams by adding substates, renaming elements, or refining transitions through simple commands
-
Intelligent Modeling Support: Advanced behavioral modeling features including entry/exit actions, event triggers, and guard conditions
-
Logical Organization: Intelligent clustering automatically groups related states, while automated layout ensures clean, readable diagrams
-
Design Validation: AI analyzes diagrams for logical flaws such as “dead-end” states or unhandled events
The AI Ecosystem
Visual Paradigm integrates AI across several platforms to provide a cohesive modeling experience:
Integrated Desktop & Online Platforms
Start a diagram using the AI Chatbot or online editor and seamlessly import it into Visual Paradigm Desktop for advanced code engineering and team collaboration.
Documentation on Demand
Automatically generate detailed project reports, summaries, and technical documentation based on visual models.
Broad Notation Support
Beyond state diagrams, AI supports over 40 diagram types including UML, BPMN, SysML, and ArchiMate.
Inter-Model Traceability
Link state diagrams to other project artifacts like use cases or user stories to maintain a single source of truth across system architecture.
Best Practices for State Machine Modeling
When to Use State Diagrams
State diagrams are ideal for modeling:
-
User interfaces (login flows, wizard steps)
-
Business processes (order lifecycle, approval workflows)
-
Embedded systems and IoT devices
-
Protocols and controllers
-
Real-time systems and safety-critical applications
Design Principles
-
Identify Clear States: Each state should represent a distinct condition with well-defined boundaries
-
Define Explicit Transitions: Every transition should have a clear trigger event
-
Use Guard Conditions Wisely: Apply guards to control when transitions can occur
-
Leverage Hierarchies: Use super-states and sub-states to manage complexity
-
Document Entry/Exit Actions: Clearly specify what happens when entering or leaving states
Common Pitfalls to Avoid
-
State Explosion: Too many states without proper hierarchy
-
Ambiguous Transitions: Missing or unclear event triggers
-
Dead-End States: States with no exit transitions
-
Unreachable States: States that can never be entered
-
Overlapping Guards: Multiple transitions with conflicting conditions
Testing State Machines
State Machine Diagrams are valuable for deriving test cases. For the heater example, test scenarios include:
-
Idle state receives “Too Hot” event
-
Idle state receives “Too Cool” event
-
Cooling/Startup state receives “Compressor Running” event
-
Cooling/Ready state receives “Fan Running” event
-
Cooling/Running state receives “OK” event
-
Cooling/Running state receives “Failure” event
-
Failure state receives “Failure Cleared” event
-
Heating state receives “OK” event
-
Heating state receives “Failure” event
Conclusion
State machine diagrams are essential tools for modeling the dynamic behavior of systems and objects. They provide a visual framework for understanding how entities transition between states in response to events, making them invaluable for designing reactive systems, user interfaces, and complex business processes.
With the advent of AI-powered modeling tools like Visual Paradigm, creating professional state diagrams has become faster and more accessible than ever. By simply describing your system in natural language, you can generate accurate, standards-compliant UML state machines in seconds, then refine them through conversational commands.
Whether you’re a software developer, systems architect, or business analyst, mastering state machine diagrams—and leveraging AI to create them—will significantly enhance your ability to design, communicate, and validate complex system behaviors.
- References
- What is State Machine Diagram?: Comprehensive guide explaining state machine diagram concepts, notation, states, transitions, events, and their application in modeling dynamic system behavior.
- UML State Machine Diagrams: A Comprehensive Guide to AI-Powered Modeling: Explores fundamentals of UML state machine diagrams, practical applications with PlantUML examples, and how AI tools accelerate development and deployment.
- Create UML State Diagrams in Seconds with AI: Article demonstrating how Visual Paradigm’s AI tools generate professional state machine diagrams from natural language descriptions.
- AI Diagram Generation: Feature overview of AI-powered diagram generation capabilities that transform text descriptions into professional UML diagrams instantly.
- AI Chatbot for Visual Modeling: Introduction to Visual Paradigm’s AI Chatbot that enables conversational diagram creation, refinement, and analysis through natural language commands.
- Enhanced AI State Machine Diagram Generation: Release notes detailing improvements to AI-powered state machine diagram generation with better state identification and transition logic.
- UML State Machine Diagram: A Definitive Guide to Modeling Object Behavior with AI: Complete guide on using AI to model object behavior with state machine diagrams, including best practices and examples.
- AI Composite Structure Diagram Generator: Guide to generating composite structure diagrams and other UML diagrams across Desktop, Chat, and OpenDocs platforms using AI.
- What Makes Visual Paradigm’s AI Chatbot Different from Other AI Diagram Tools: Comparison article highlighting unique features of Visual Paradigm’s AI Chatbot for technical modeling and diagram generation.
- Guide to AI-Powered UML Diagram Generation: Comprehensive guide exploring how AI revolutionizes UML workflow, enabling teams to move from abstract ideas to structured visual designs in seconds.
- Comprehensive Review: Visual Paradigm’s AI Diagram Generation Features: Independent review examining Visual Paradigm’s AI diagram generation capabilities, accuracy, and practical applications.
- How Visual Paradigm’s AI-Powered Ecosystem Transforms UML Development: Analysis of how Visual Paradigm’s integrated AI ecosystem enhances UML development, modeling efficiency, and system design.
- This comprehensive guide provides everything you need to understand, create, and leverage state machine diagrams effectively, whether manually or with AI-powered tools.