


Designing distributed systems requires more than just code; it demands a clear understanding of how components interact. In the context of Event-Driven Architectures (EDA), standard linear flow diagrams often fall short. This guide explores the nuances of creating effective communication diagrams specifically tailored for asynchronous environments. We will delve into the mechanics of message passing, the visibility of system state, and the representation of non-blocking interactions without relying on specific vendor tools.
Asynchronous communication introduces complexity that synchronous models do not. Messages travel through queues, brokers, and channels where latency and ordering become critical variables. A well-crafted diagram serves as a blueprint for developers, allowing them to visualize the flow of data across service boundaries. This visual representation helps in identifying bottlenecks, understanding error propagation, and ensuring data consistency across the distributed network.
🧩 The Role of Communication Diagrams in EDA
A communication diagram, often associated with Unified Modeling Language (UML), focuses on the organization of objects and the links between them. In a service-oriented or microservices context, these diagrams map out the relationships between distinct processes. When dealing with asynchronous calls, the diagram must evolve to show not just who talks to whom, but how messages persist and move through the system.
- Focus on Structure: Unlike sequence diagrams which emphasize time, communication diagrams highlight the structural relationships and the messages exchanged between participants.
- Message Identification: Each arrow represents a message, command, or event. The label on the arrow clarifies the payload type and the intent of the interaction.
- Participant Clarity: Every box represents a logical unit of processing. Clear labeling ensures that the diagram remains readable even as the system scales.
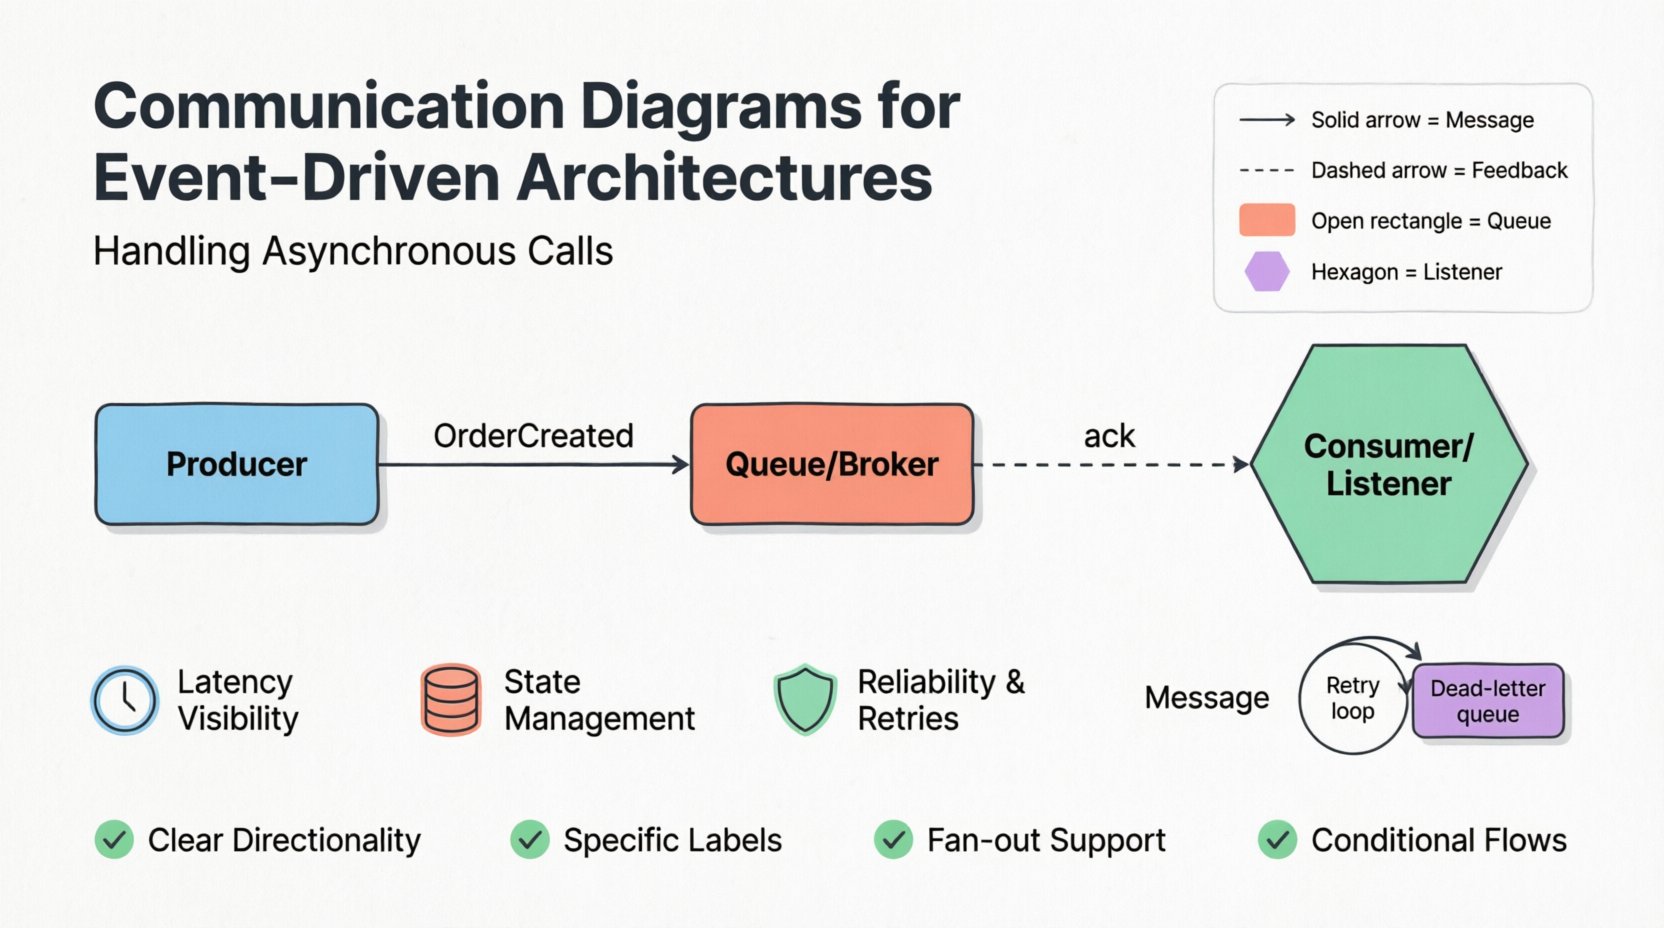
In an event-driven context, the diagram acts as a contract. It defines the expectations between a producer and a consumer. Producers send events without waiting for an immediate response. Consumers listen for these events and process them independently. The diagram captures this decoupling, showing the flow from the source to the destination via an intermediate channel.
⚡ Understanding Asynchronous Challenges
Synchronous calls are straightforward. A request is sent, a response is received, and the process continues. Asynchronous calls break this linear path. The sender fires a message and continues its work. The receiver processes the message at a later time. This introduces several challenges that must be visually represented.
- Latency Visibility: The time gap between sending and processing is invisible in code but crucial for performance tuning.
- State Management: The system state changes at different times for different components. The diagram must reflect this eventual consistency.
- Reliability: What happens if the message is lost? The diagram should indicate retry mechanisms and dead-letter queues.
When visualizing these challenges, it is essential to avoid the assumption that a call results in an immediate return. Instead, the diagram shows a message entering a buffer. This buffer represents a message broker or a queueing system. The arrow points to the buffer, not directly to the consumer. This distinction is vital for understanding the system’s resilience.
🔄 Visualizing Message Flow
The core of an asynchronous diagram is the message flow. Unlike a request-response pattern, this flow is often one-way. The sender does not wait. The consumer decides when to act. To represent this effectively, specific notations are used to denote the nature of the interaction.
| Element | Representation | Purpose |
|---|---|---|
| Message | Solid Arrow | Indicates a standard event or command transmission. |
| Feedback | Dashed Arrow | Indicates an acknowledgment or status update sent back later. |
| Queue | Open Rectangle | Represents the buffer holding messages before processing. |
| Listener | Hexagon | Denotes the component actively waiting for incoming messages. |
Using these standard visual elements helps teams maintain a consistent language. When a new developer joins the project, they can interpret the diagram without needing extensive verbal explanation. The arrows show the direction of data, while the shapes show the nature of the component.
📝 Key Considerations for Flow
- Directionality: Ensure arrows clearly point from the sender to the receiver. Ambiguity leads to implementation errors.
- Labeling: Every message should have a name. “Event Data” is vague. “OrderCreated” is specific.
- Multiple Receivers: A single event might trigger multiple consumers. Show branching paths to indicate fan-out patterns.
- Processing Order: While time is less emphasized in communication diagrams, the logical order of processing should be clear.
🕒 Timing and Ordering Constraints
Even in asynchronous systems, timing matters. Some events must be processed before others. Dependency chains exist even when there is no direct waiting. For example, a “PaymentProcessed” event should not trigger “OrderShipped” until the payment is confirmed. The diagram must capture these logical dependencies.
One approach is to use conditional arrows. An arrow might be labeled with a condition like [Payment Confirmed]. This indicates that the flow to the next step is conditional upon the success of the previous operation. It prevents the assumption that all paths are always taken.
- Sequential Dependencies: Show cases where Step B cannot start until Step A completes, even if they are asynchronous.
- Parallel Processing: Indicate when multiple consumers can process the same event simultaneously for scalability.
- Timeouts: Mark edges with timeout values if a process must fail if no response is received within a certain timeframe.
Ordering constraints are critical for data integrity. If a “UserUpdated” event arrives before a “UserCreated” event, the system might crash or produce inconsistent data. The diagram helps architects identify these race conditions before writing code.
❌ Error Handling and Retries
Networks fail. Services crash. Messages get corrupted. A robust diagram must account for failure. In a synchronous call, an error is an immediate exception. In an asynchronous system, an error might result in a message being moved to a dead-letter queue or a retry loop.
Visualizing error paths is often overlooked but essential. Include branches in the diagram that represent failure states. If a consumer cannot process a message, where does it go?
- Retry Logic: Show a loop back to the queue indicating that the message will be retried after a delay.
- Dead-Letter Queue: Show a specific path for messages that fail after maximum retries. This isolates bad data from the main flow.
- Circuit Breakers: Indicate points where the system stops sending messages to a failing service to prevent cascading failures.
- Alerting: Mark paths that trigger notifications to the operations team when critical errors occur.
By mapping out these error scenarios, the team prepares for the unexpected. It shifts the mindset from “happy path” development to resilient system design. The diagram becomes a tool for disaster recovery planning as well as feature implementation.
🛠 Best Practices for Diagramming
Creating these diagrams is not just about drawing arrows. It requires discipline and adherence to standards. A cluttered diagram is useless. A clear diagram accelerates development.
📌 Guidelines for Clarity
- Keep it High-Level: Do not include every single internal method call. Focus on the boundaries between services.
- Use Consistent Naming: Ensure that “OrderService” in the diagram matches the code namespace.
- Version Control: Treat the diagram as code. Store it in the same repository and review changes via pull requests.
- Limit Complexity: If a diagram becomes too large, split it into multiple views. One view for the ordering flow, another for the payment flow.
🔄 Maintenance
Systems evolve. Features are added, and old ones are removed. A diagram that is outdated is worse than no diagram at all. Establish a process where the diagram is updated whenever the code changes. This ensures the documentation remains a source of truth.
⚠️ Common Pitfalls to Avoid
Even experienced architects make mistakes when visualizing asynchronous flows. Being aware of these common pitfalls can save time and reduce confusion.
- Assuming Immediate Delivery: Do not draw arrows that imply instant arrival. Remember that queues introduce delay.
- Ignoring Idempotency: If a message is delivered twice, does the system handle it correctly? The diagram should hint at duplicate handling mechanisms.
- Over-Engineering: Do not try to diagram every edge case. Focus on the primary flows and major exceptions.
- Ignoring Correlation IDs: In distributed tracing, tracking a request across services is vital. Indicate where correlation IDs are passed in the message headers.
📈 Impact on Documentation Strategy
These diagrams are part of a larger documentation strategy. They complement API specifications and deployment runbooks. When a developer needs to understand how data moves from the frontend to the backend, the communication diagram provides the missing context.
Integrating these diagrams into the codebase documentation ensures that new hires can onboard faster. They can see the big picture without needing to read every line of code. This reduces the cognitive load on the team and improves overall system understanding.
🔍 Summary of Key Takeaways
- Visual Clarity: Use standard shapes and arrows to represent queues, consumers, and producers.
- Asynchronous Reality: Acknowledge delays and eventual consistency in your visual models.
- Error Paths: Always include failure scenarios and retry logic in the flow.
- Living Documents: Treat diagrams as living artifacts that must evolve with the code.
- Communication: Use these diagrams to align the team on system behavior and expectations.
Effective communication diagrams for event-driven architectures are more than just pictures. They are a critical tool for managing complexity. By visualizing asynchronous calls, teams can build systems that are robust, scalable, and easier to maintain. The effort invested in creating accurate diagrams pays dividends in reduced debugging time and clearer architectural decisions.
As you move forward with your system design, prioritize the clarity of your interactions. Ensure that every message has a defined path and every failure has a defined handler. This discipline forms the foundation of reliable distributed systems.