


Designing complex systems often feels like navigating a maze without a map. Whether you are building a user authentication flow, a game AI, or an embedded controller, the logic can become tangled quickly. A state diagram provides the clarity needed to visualize how a system behaves over time. This guide explains how to model Finite State Machines (FSM) using visual methods, stripping away the complex mathematical notation usually associated with formal methods.
By the end of this tutorial, you will understand the core components of state modeling, how to draw transitions that represent real-world logic, and how to avoid common design pitfalls. You do not need a degree in computer science to use these tools effectively. You only need a clear mind and a structured approach. Let us begin.
🤔 What is a Finite State Machine?
A Finite State Machine is a mathematical model of computation. However, thinking of it purely mathematically creates unnecessary barriers. In practical software and systems engineering, an FSM is simply a way to describe how an object changes its behavior based on inputs. It has a limited number of states it can occupy at any given moment.
Consider a simple light switch. It has two states: On and Off. It reacts to a single event: Flip Switch. This is an FSM. Now consider a coffee machine. It has states like Idle, Heating, Brewing, and Error. It reacts to events like Select Coffee, Water Low, or Power Button.
The key takeaway is exclusivity. At any specific instant, the system exists in exactly one state. It cannot be Heating and Brewing simultaneously unless you define those as a combined state. This simplicity is why state diagrams are so powerful for documentation and debugging.
🛠️ Core Components of a State Diagram
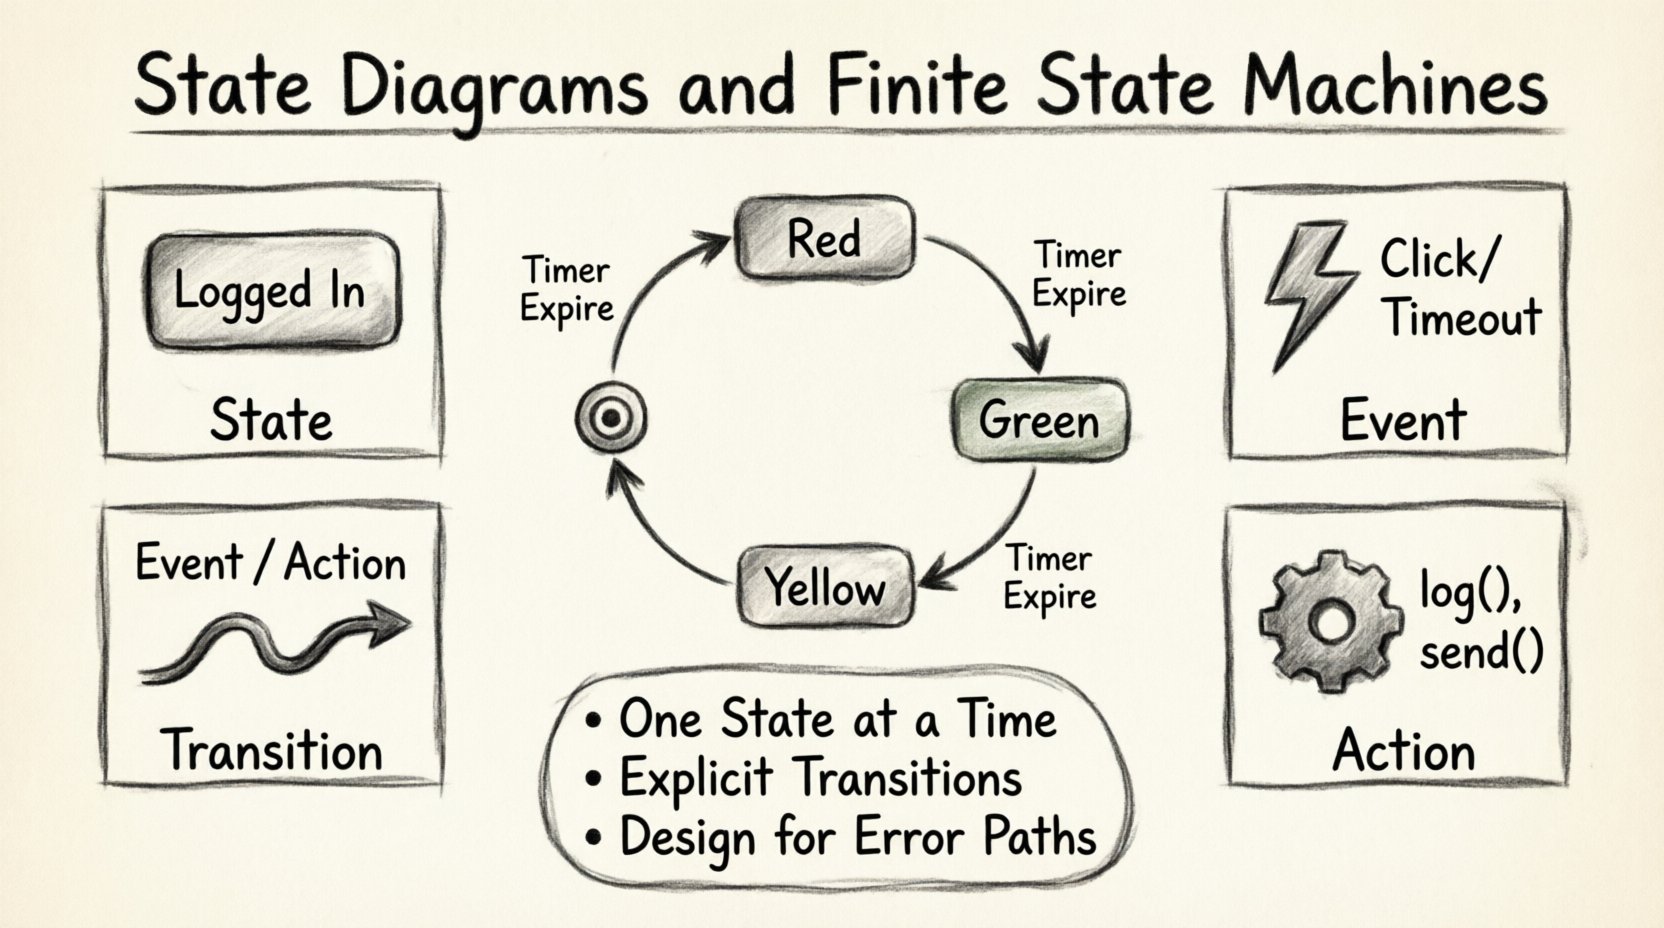
To build a diagram without confusion, you must understand the four pillars of state modeling. Every valid state diagram is constructed from these elements.
- States: These represent the conditions of the system. They are the “nouns” of your logic. Examples include Logged In, Processing, or Waiting.
- Events: These are the triggers that cause a change. They are the “verbs” or external signals. Examples include Click, Timeout, or Data Received.
- Transitions: These are the lines connecting states. They show the path from one condition to another when an event occurs.
- Actions: These are the tasks performed during a transition or while inside a state. They are the “what happens next” logic.
📊 Understanding the Relationship
| Component | Visual Representation | Role in Logic |
|---|---|---|
| State | Rounded Rectangle | Holds the current context or data. |
| Transition | Arrow with Label | Defines the path and trigger. |
| Event | Text Label on Arrow | Specifically triggers the move. |
| Action | Text Label on Arrow | Defines the side effect (e.g., log(), send()). |
🎨 Standard Symbols and Notation
While tools vary, standard notation exists to ensure diagrams are readable across different teams. Using these symbols ensures that anyone reading your diagram understands the intent without needing a legend.
1. The Initial State (Start)
The diagram begins here. Visually, this is a solid black circle. It represents the entry point of the system. When the object is created or the process starts, it enters this state immediately.
2. The Final State (End)
The diagram ends here. Visually, this is a solid black circle inside a larger circle (bullseye). It represents the termination of the process. A system may have multiple final states (e.g., Success vs. Failure).
3. Regular States
These are the working conditions. They are drawn as rounded rectangles. The name of the state goes inside. If the state requires a specific action to happen while waiting, you can list it inside the box using the entry/ notation.
4. Transitions
Lines with arrows indicate movement. They must always go from one state to another. You can loop back to the same state if the logic dictates it. The label on the line usually follows the format:
Event: The trigger./ Action: What happens immediately.
For example: Submit / Validate means when the Submit event occurs, the system performs the Validate action.
🚀 Step-by-Step Modeling Guide
Now that we know the symbols, let us walk through the process of creating a diagram from scratch. Follow these steps to ensure logical consistency.
Step 1: Define the Scope
Before drawing, identify the boundaries of the system. Are you modeling the entire application, or just the login module? Scope creep is the enemy of clear diagrams. Define what is in and what is out of the FSM.
Step 2: List All Possible States
Brainstorm every condition the system can exist in. Ask yourself: “What can I say about this system right now?”
- Is it running?
- Is it paused?
- Is it waiting for input?
- Is it in an error state?
Write these down. Do not worry about connections yet. Just list the nouns.
Step 3: Identify the Events
What changes the state? List every external input or internal trigger.
- User clicks a button.
- Network timeout occurs.
- Database query returns.
- Timer expires.
Step 4: Draw the Initial and Final States
Place the black circle at the top (start) and the bullseye at the bottom (end). This anchors your diagram.
Step 5: Connect the States
Draw arrows between the states based on your events. If State A can become State B when Event X happens, draw a line from A to B and label it with X. Ensure there are no loose ends unless the system is designed to hang (which is rare).
Step 6: Review for Deadlocks
Check every state. Can the system get stuck? If a state has no outgoing arrows, it is a deadlock unless it is a final state. If a state has no incoming arrows, it is unreachable. Both are usually errors in design.
🌍 Real-World Examples
Theory is abstract. Let us look at concrete scenarios to ground the concepts.
Example 1: The Login Flow
This is a common pattern in web applications. The system transitions based on user input and server responses.
- States: Idle, Validating, Authenticated, Locked Out.
- Events: Enter Credentials, Server Response, Max Attempts.
- Logic:
- From Idle to Validating on Enter Credentials.
- From Validating to Authenticated on Success.
- From Validating to Locked Out on Failure (3 times).
This logic prevents users from guessing passwords indefinitely and handles network latency gracefully.
Example 2: A Traffic Light System
Embedded systems rely heavily on FSMs. A traffic light must cycle through colors strictly.
- States: Red, Green, Yellow.
- Events: Timer Expire.
- Logic:
- Red → (Timer) → Green
- Green → (Timer) → Yellow
- Yellow → (Timer) → Red
Notice the loop. The system never reaches a “Final State” in this context; it is a continuous process. The diagram reflects a cycle.
Example 3: E-Commerce Order Processing
Complex business logic requires careful state management to ensure data integrity.
- States: New, Paid, Shipped, Delivered, Cancelled.
- Events: Payment Success, Ship Item, Customer Request Cancel.
- Constraints: You cannot ship an order that is Cancelled. The diagram should explicitly prevent this transition.
🧩 Advanced Concepts
As systems grow, simple linear flows are insufficient. You may need to handle complexity without making the diagram unreadable.
Substates (Hierarchy)
When a state contains complex logic, you can nest another diagram inside it. This is called a substate. For example, the Playing state in a media player might have substates like Buffering, Paused, or Seeking. This keeps the main diagram clean while detailing the internal behavior of a specific state.
Orthogonal Regions (Parallelism)
Sometimes a system does multiple things at once. If a state has multiple independent regions, it means those parts operate concurrently. For example, a smartwatch might be Tracking Heart Rate and Synchronizing Data at the same time. The diagram splits the state box into sections to show these parallel activities.
History States
When a user exits a complex state and returns, should the system reset to the beginning of that state, or resume where it left off? A History State (often a dashed circle) remembers the last active substate. This is crucial for user experience in mobile applications.
⚠️ Common Pitfalls to Avoid
Even experienced engineers make mistakes when modeling. Watch out for these common traps.
- Overlapping States: Do not draw arrows crossing each other. Use routing or bend lines to keep the diagram tidy. Crossing lines confuse the reader.
- Missing Error Handling: Every transition should consider what happens if things go wrong. If a network call fails during Validating, where does the arrow go? If it goes nowhere, the system crashes.
- Too Many States: If a state has more than 10 incoming and outgoing transitions, it is likely too complex. Break it down into substates.
- Implicit Logic: Do not assume the reader knows the business rules. Write the event and action clearly on the arrow. Do not leave it for verbal explanation.
- Ignoring Entry/Exit Actions: Sometimes an action happens immediately upon entering a state, not during the transition. Use the
entry/syntax to distinguish this from transition actions.
🛡️ Best Practices for Maintenance
A state diagram is a living document. It must evolve as the software changes. Follow these guidelines to keep your documentation valuable.
- Keep it High Level: Do not map every single function call. Map the logical states. Technical implementation details belong in code comments, not diagrams.
- Use Consistent Naming: If you call a state Processing in one diagram, do not call it Working in another. Consistency reduces cognitive load.
- Validate with the Team: Review the diagram with developers and product managers. If they interpret a transition differently than you did, the diagram is unclear.
- Version Control: Treat the diagram file like code. Commit changes when logic changes. This creates an audit trail of why decisions were made.
- Link to Code: If possible, reference the specific module or class that implements the logic. This bridges the gap between design and implementation.
📈 Why Visualizing Matters
Why go through the effort of drawing this? Textual descriptions of logic are often ambiguous. A sentence like “The system checks if the user is logged in before showing the dashboard” leaves questions: What if they are not? Does it redirect? Does it show an error? Does it stay on the same page?
A state diagram removes this ambiguity. It forces you to define the else case explicitly. If you cannot draw an arrow for the else case, you do not have a complete design yet.
Furthermore, state diagrams are excellent for testing. You can generate test cases for every transition. If the diagram shows a transition from Idle to Processing, a test case must exist that verifies this move. This ensures code coverage is high and logic errors are caught early.
🔧 Tools and Implementation
You do not need expensive software to create these diagrams. Many lightweight editors support standard notation. When choosing a tool, look for the following features:
- Drag-and-Drop Interface: Easy manipulation of nodes and edges.
- Export Options: Ability to export as SVG, PNG, or PDF for documentation.
- Code Generation: Some tools can generate skeleton code for the FSM, saving implementation time.
- Collaboration: Real-time editing allows teams to build the diagram together.
Remember, the tool is secondary to the logic. A hand-drawn sketch on a whiteboard is better than a polished diagram with incorrect logic. Start simple.
🧠 Summary of Key Takeaways
Modeling Finite State Machines is a skill that improves system reliability. By visualizing the flow of control, you reduce bugs and improve communication. Remember these core principles:
- One State at a Time: Ensure the system is never in two contradictory states simultaneously.
- Explicit Transitions: Every move must have a trigger and a destination.
- Error Paths: Design for failure. Where does the flow go when things break?
- Clarity: Use standard symbols and clear labels. Avoid clutter.
State diagrams are not just for theorists. They are practical tools for anyone building software, hardware, or business processes. By mastering the visual language of states, you gain control over complexity without needing to understand the underlying mathematics. Focus on the flow, the events, and the outcomes. The rest follows naturally.