Distributed systems rely heavily on the movement of information between isolated components. When building microservices, the architecture is not just about separating code; it is about orchestrating how data travels across a network. Understanding Data Flow Logic is essential for maintaining system integrity, performance, and reliability. Without a clear map of where data originates, where it transforms, and where it settles, systems become opaque and difficult to troubleshoot.
This guide explores the methodology of mapping these flows. We will look at the structural components, the logic behind data movement, and the patterns that govern communication between services. The goal is to create a transparent architecture where every transaction is accounted for.
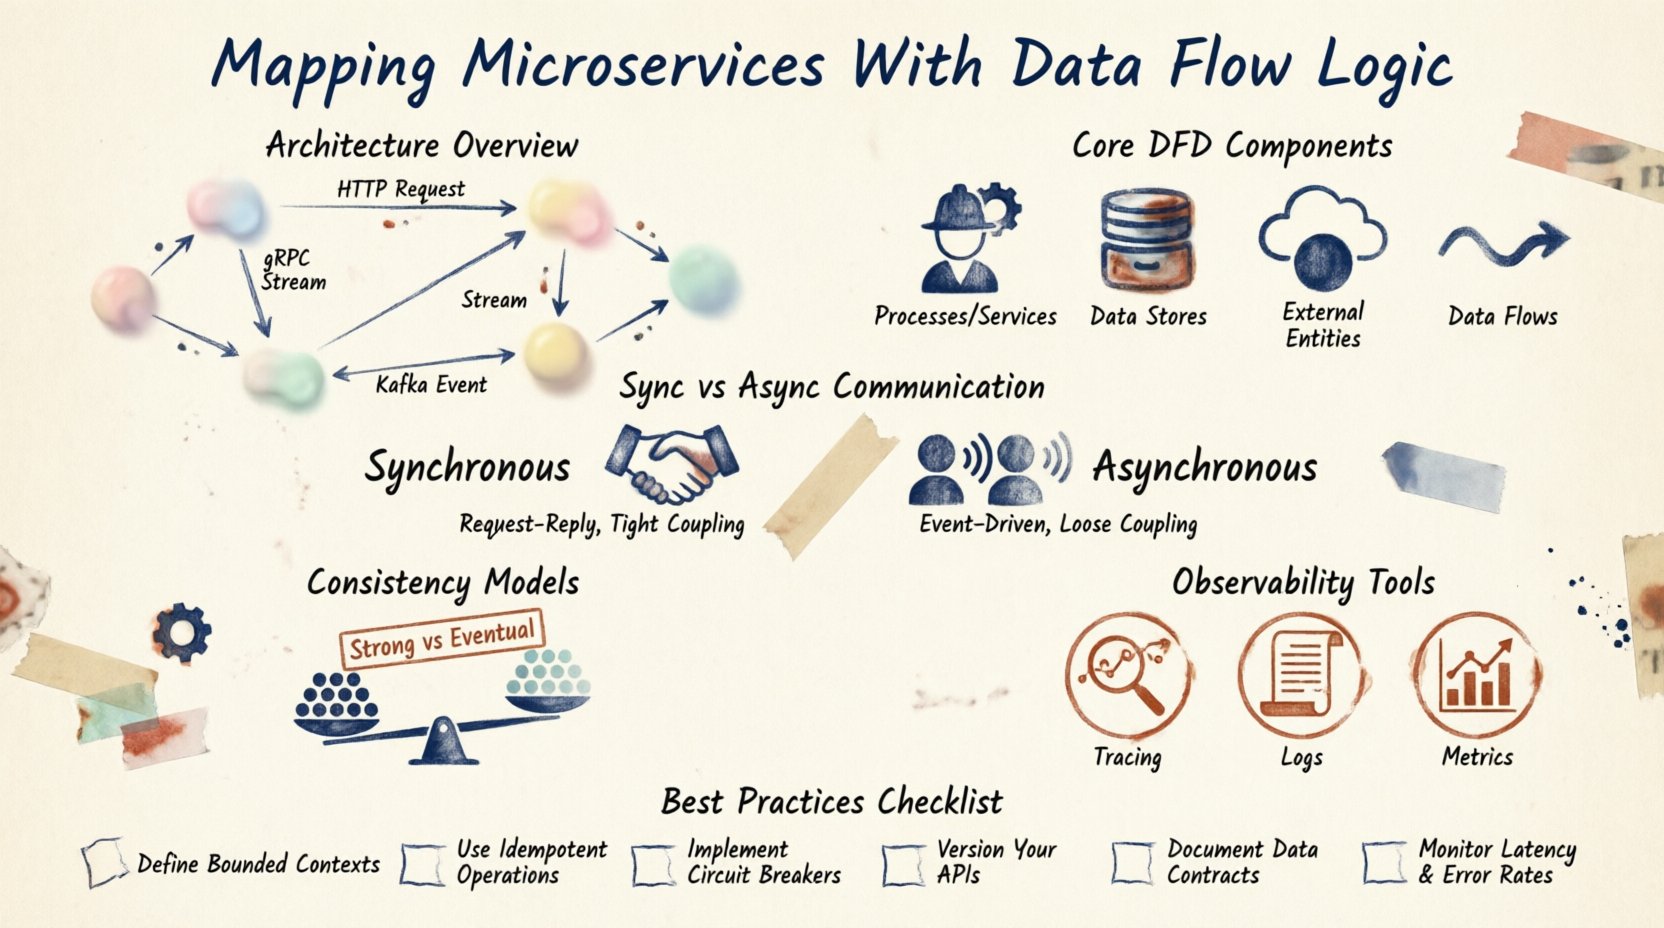
Understanding the Architecture 🏗️
Microservices architecture decomposes a monolithic application into smaller, independent units. Each unit handles a specific business capability. However, this independence introduces complexity regarding state management and communication. Data does not exist in a vacuum; it moves.
When you map these services, you are essentially drawing a blueprint of the system’s nervous system. You need to identify the producers of data and the consumers. You must understand the protocols used for transmission. Are the services talking directly via HTTP? Are they using a message queue? Are they accessing a shared database?
Clarity in this area prevents coupling. If Service A depends on Service B to function, that dependency must be explicit in your maps. Hidden dependencies lead to cascading failures. By visualizing the flow, you can identify bottlenecks before they impact production performance.
Key Drivers for Mapping
- Observability: You cannot debug what you cannot see. A clear map helps in tracing requests across the distributed environment.
- Security: Understanding data flow allows you to apply encryption and access controls at the right boundaries.
- Performance: Identifying high-latency paths helps in optimizing network calls and database queries.
- Compliance: Regulations often require knowing where sensitive data resides and how it moves.
Core Components of Data Flow Diagrams 📊
A Data Flow Diagram (DFD) provides a standardized way to represent these interactions. In the context of microservices, the components are slightly different from traditional software engineering DFDs.
1. Processes (Services)
These are the active elements. Each microservice represents a process that transforms input data into output data. For example, an Order Service receives order details and transforms them into an inventory reservation.
2. Data Stores
Data does not always stay in memory. It often persists in databases, caches, or object storage. In a microservices environment, services typically have private data stores. This ensures loose coupling. If a database schema changes, only the owning service needs to adapt.
3. External Entities
These are actors outside the system. They could be a third-party payment gateway, a mobile application, or a user. They initiate requests or receive notifications. Mapping these boundaries is crucial for API gateway design.
4. Data Flows
These are the arrows connecting the components. They represent the movement of information. Each flow should have a label describing the data being transferred. Is it a JSON payload? Is it a binary file? Is it an event notification?
Step-by-Step Mapping Process 🗺️
Creating a map is a systematic exercise. It requires breaking down the system layer by layer. Here is a logical approach to constructing these diagrams.
- Identify the Boundary: Define what is inside the system and what is outside. This sets the scope for your diagram.
- List the Services: Enumerate every microservice involved in the specific business process you are analyzing.
- Define the Data Entry Points: Where does the data enter the system? Is it an API endpoint? A scheduled job? A message queue consumer?
- Trace the Path: Follow a single piece of data from entry to exit. Note every service it touches.
- Identify Storage: Mark where data is read from or written to at each step.
- Validate the Logic: Review the map with the development team to ensure it matches the actual implementation.
Communication Patterns 📡
How services talk to each other determines the flow logic. There are two primary modes: synchronous and asynchronous.
Synchronous Communication
Service A calls Service B and waits for a response. This is often implemented via REST or gRPC. It provides immediate feedback but creates tight coupling. If Service B is slow, Service A hangs.
Asynchronous Communication
Service A sends a message and continues working. Service B picks it up when ready. This uses message brokers or event streams. It improves resilience but makes tracking state harder.
| Aspect |
Synchronous |
Asynchronous |
| Latency |
Higher (Blocking) |
Lower (Non-Blocking) |
| Coupling |
Tight |
Loose |
| Complexity |
Simple to trace |
Requires Event Sourcing |
| Failure Handling |
Retry immediately |
Dead Letter Queues |
Consistency Models 🤝
In a distributed system, data consistency is a major concern. You cannot rely on a single transaction across multiple databases. You must decide on a consistency model.
Strong Consistency
Every read receives the most recent write. This is difficult to achieve across microservices without blocking. It often requires distributed locking mechanisms.
Eventual Consistency
Data will be consistent after some time. Updates propagate asynchronously. This is the standard for most microservices. It allows for high availability but requires the application to handle temporary data mismatches.
Observability and Tracing 🔍
Once the map is drawn, you need tools to monitor it. Distributed tracing allows you to follow a request ID through every service. This is vital for debugging.
Logs should be correlated. If a request fails, the logs from the Gateway, the Order Service, and the Payment Service must link together. This linkage is the digital twin of your Data Flow Diagram.
Metrics are also part of the flow. You should track the volume of messages, the latency of calls, and the error rates. These metrics validate the health of the data paths you have designed.
Best Practices for Maintenance 🛠️
A diagram is only useful if it stays accurate. Systems evolve, and the map must evolve with them.
- Automate Generation: Where possible, generate diagrams from code or infrastructure as code. This reduces manual errors.
- Version Control: Store your diagrams in the same repository as your code. Review them during pull requests.
- Regular Audits: Schedule quarterly reviews to ensure the map matches the running system.
- Document Protocols: Clearly define the data formats. Use schemas to enforce structure across services.
Challenges in Distributed Flows ⚠️
Mapping these systems is not without difficulties. Networks fail. Services restart. Data gets lost.
Network Latency: Physical distance between services can impact performance. You must account for this in your timing logic.
Data Fragmentation: Data is spread across many stores. Reconstructing a full view of an entity requires joining data from different sources. This adds complexity to queries.
Orchestration vs. Choreography: You must decide who controls the flow. Orchestration uses a central coordinator. Choreography relies on events. Both have trade-offs regarding visibility and control.
Future-Proofing the Design 🔮
Technology changes. Protocols evolve. Your map should be abstract enough to survive these shifts.
Focus on the business logic rather than the implementation details. Describe what the data means, not just how it is encoded. This abstraction allows you to swap underlying technologies without rewriting the entire architecture.
Consider scalability. Can the flow handle ten times the load? Does the map show where bottlenecks might occur? Design for growth from the start.
Final Thoughts on Data Logic
Mapping microservices with data flow logic is a foundational skill for architects. It moves the conversation from abstract code to concrete movement. By visualizing the flow, teams can make better decisions about resilience, security, and performance.
It requires discipline to keep the maps updated. It requires collaboration to ensure everyone understands the paths. But the result is a system that is easier to build, easier to debug, and easier to scale. The data flows clearly, and the system remains stable under pressure.
Invest the time in these diagrams. They serve as the documentation for your system’s lifeblood. When the lights go out on a production server, these maps are what guide the recovery.