Data Flow Diagrams (DFDs) serve as a cornerstone in systems analysis and design. They provide a visual representation of how information moves through a system, highlighting interactions between external entities, internal processes, data stores, and the flows connecting them. While the concept is straightforward, the granularity of these diagrams varies significantly depending on the level of detail required. Two of the most critical stages in this hierarchy are Level 0 and Level 1 DFDs. Understanding the distinction between these two levels is essential for architects, analysts, and stakeholders who need to communicate system logic without getting lost in unnecessary complexity.
This guide explores the structural differences, use cases, and best practices for creating Level 0 and Level 1 diagrams. We will examine how to transition from a high-level context view to a detailed functional decomposition, ensuring clarity and precision in your system documentation.
🧭 What is a Level 0 Data Flow Diagram?
A Level 0 DFD, often referred to as the
Context Diagram, represents the system as a single, monolithic process. It is the highest level of abstraction in the DFD hierarchy. The primary goal here is to define the boundaries of the system and show how it interacts with the outside world.
Key Characteristics
- Single Process Node: The entire system is depicted as one circle or rounded rectangle, usually labeled with the system name.
- External Entities: These are sources or destinations of data that exist outside the system boundary. Examples include users, other systems, or regulatory bodies.
- Data Flows: Arrows indicate the input and output of data between external entities and the system.
- No Internal Detail: There are no data stores, sub-processes, or internal data movements shown.
This diagram answers the question:
“What does the system do, and who does it interact with?” It is typically the first artifact created during the requirements gathering phase. It provides a shared understanding among stakeholders regarding the scope of the project before diving into the mechanics.
Visual Structure of Level 0
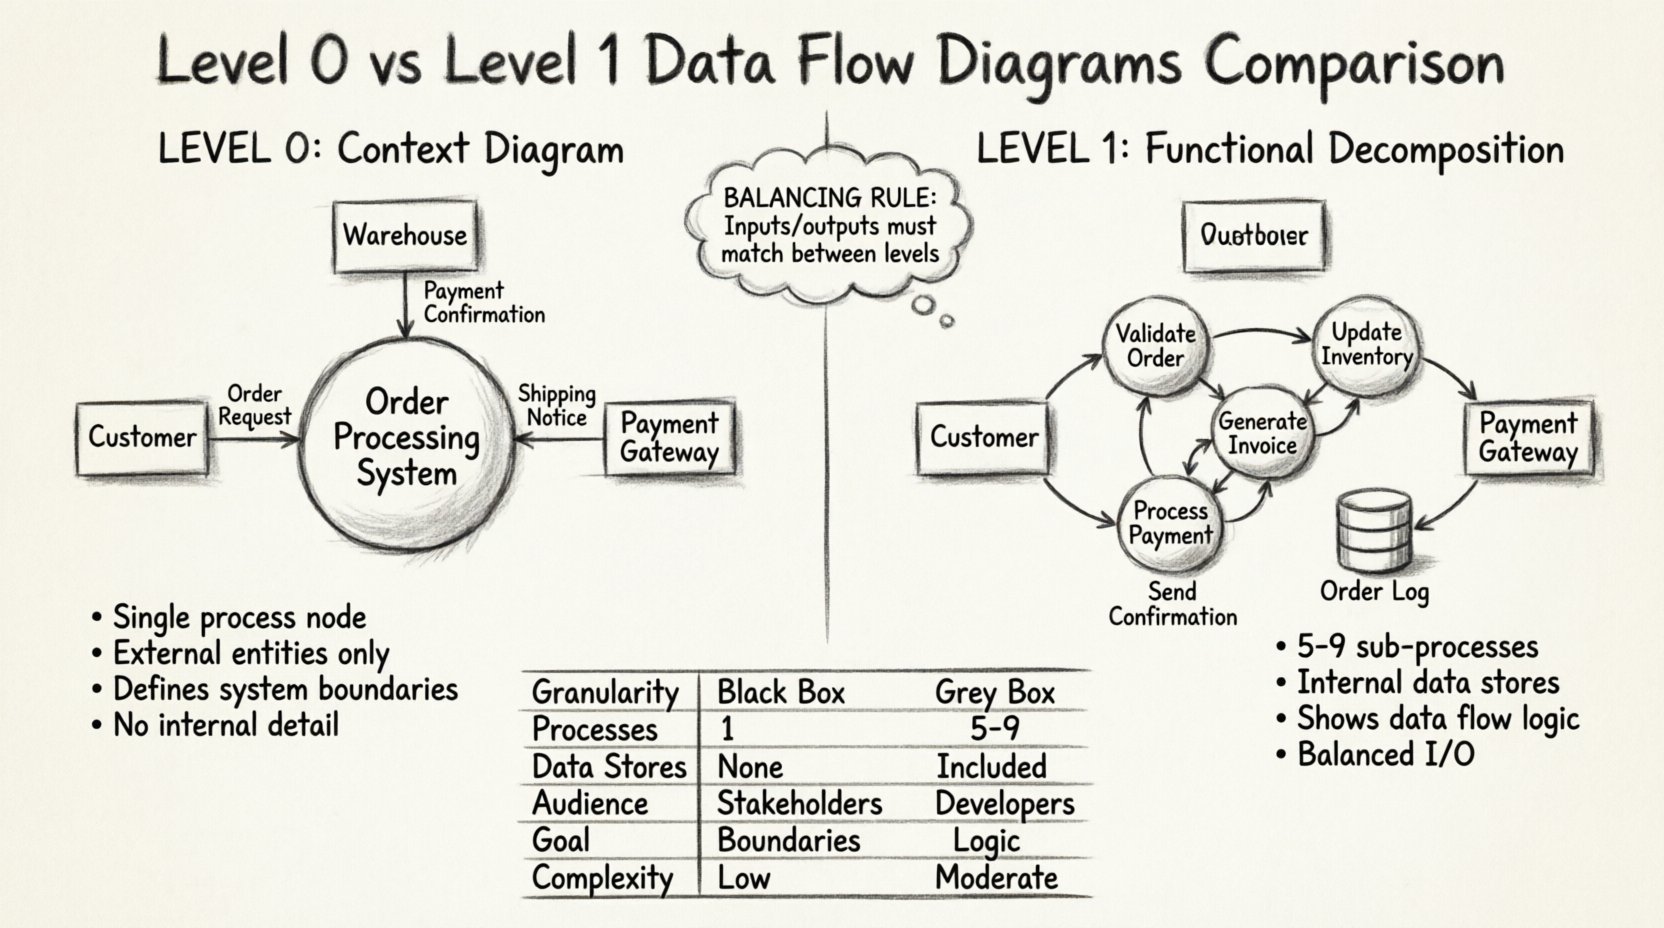
Imagine a large circle in the center of the page labeled “Order Processing System.” Surrounding this circle are rectangles representing external entities, such as “Customer,” “Warehouse,” and “Payment Gateway.” Lines connect these rectangles to the central circle, labeled with the data being exchanged, like “Order Request” or “Payment Confirmation.” This simplicity ensures that non-technical stakeholders can quickly grasp the system’s purpose.
⚙️ What is a Level 1 Data Flow Diagram?
A Level 1 DFD expands upon the Level 0 diagram by decomposing the single system process into major sub-processes. It reveals the internal logic of the system without going into minute detail. This level bridges the gap between the high-level context and the detailed design specifications.
Key Characteristics
- Decomposed Processes: The single process from Level 0 is broken down into 5 to 9 major sub-processes. This number is a guideline to maintain readability.
- Internal Data Stores: This level introduces repositories where data is held, such as databases, files, or queues.
- Refined Data Flows: The arrows now show how data moves between sub-processes and data stores.
- Balanced Inputs/Outputs: The inputs and outputs of the Level 0 process must match the aggregate inputs and outputs of the Level 1 sub-processes.
This diagram answers the question:
“How does the system achieve its function?” It is crucial for developers and system architects who need to understand the flow of information to build the underlying architecture.
Visual Structure of Level 1
Using the previous example, the “Order Processing System” circle is replaced by a collection of smaller circles. One might be “Validate Order,” another “Update Inventory,” and a third “Generate Invoice.” These circles are connected by arrows showing data moving between them. Additionally, a cylinder shape might appear, representing a “Customer Database” or “Order Log.” This structure allows the team to see dependencies and data retention requirements.
🆚 Comparison: Level 0 vs Level 1
To clarify the distinctions, we can compare these two levels across several dimensions. This table highlights the structural and functional differences.
| Feature |
Level 0 (Context Diagram) |
Level 1 (Functional Decomposition) |
| Granularity |
System-wide view (Black Box) |
Major functional modules (Grey Box) |
| Number of Processes |
Exactly 1 |
5 to 9 major sub-processes |
| Data Stores |
None shown |
Explicitly included |
| Audience |
Stakeholders, Management, Users |
Developers, System Architects, Analysts |
| Primary Goal |
Define system boundaries |
Define internal logic and flow |
| Complexity |
Low |
Moderate |
🔄 The Concept of Balancing
A critical rule when moving from Level 0 to Level 1 is
balancing. The inputs and outputs entering and leaving the Level 0 process must be identical to the inputs and outputs entering and leaving the Level 1 sub-processes combined. This ensures that no data is created or destroyed during the decomposition process.
For instance, if Level 0 shows an input of “Customer Data” entering the system, Level 1 must show “Customer Data” flowing into at least one of the sub-processes. If Level 0 shows an output of “Receipt” leaving the system, Level 1 must show a sub-process generating “Receipt” data. Failure to maintain this balance indicates an error in the analysis or a missing component in the design.
🛠 Best Practices for Design
Creating effective DFDs requires discipline and adherence to specific conventions. Following these guidelines helps maintain clarity and prevents confusion.
1. Naming Conventions
Processes should be named using a verb-noun structure (e.g., “Calculate Tax” rather than “Tax”). Data flows should be named with noun phrases indicating the content (e.g., “Invoice Details” rather than “Invoice”). External entities should be named clearly to reflect the actor or system providing the data.
2. Avoiding Crossings
Diagram layout should minimize the crossing of data flow lines. Crossing lines create visual noise and make it difficult to trace the path of information. If crossings are unavoidable, ensure they are distinct and labeled clearly.
3. Data Store Consistency
Ensure that data stores are labeled consistently across diagrams. A database named “Customer DB” in Level 1 should not be renamed “User Table” in Level 2. Consistency aids in navigation and understanding across different levels of the hierarchy.
4. Limiting Sub-Processes
While Level 1 should be detailed, it should not be exhaustive. If a single sub-process contains too much logic, it may require its own Level 2 decomposition. However, Level 1 should generally remain within a manageable scope to avoid overwhelming the reader.
📈 When to Use Each Level
Selecting the appropriate level depends on the project phase and the audience.
Use Level 0 For:
- Project Initiation: To establish scope and boundaries early.
- Executive Summaries: To provide non-technical leadership with a high-level overview.
- Interface Definition: To clarify where the system connects with external systems.
Use Level 1 For:
- System Design: To guide the development team on internal logic.
- Integration Planning: To identify where data stores and internal flows occur.
- Testing Strategy: To define test cases based on process paths and data transformations.
🔍 Common Challenges and Solutions
Creating these diagrams often presents specific challenges. Being aware of these issues helps in producing accurate artifacts.
Issue: Missing Data Stores
Analysts sometimes forget to include data stores in Level 1 diagrams, assuming data flows directly between processes. However, most systems require persistence. Ensure you identify where data is saved between transactions.
Issue: Ghost Data Flows
A ghost data flow is an arrow that points nowhere or originates from nowhere. Every arrow must start at a source (Process, Entity, or Store) and end at a destination. Check your diagram to ensure all lines are properly anchored.
Issue: Over-Complexity
Trying to show every single step in Level 1 can lead to a cluttered diagram. If the Level 1 diagram becomes unreadable, consider splitting the system into logical subsystems and creating separate Level 1 diagrams for each, rather than one massive diagram.
🔗 Transitioning to Higher Levels
Once the Level 1 diagram is complete, it serves as the parent for Level 2 diagrams. Each sub-process from Level 1 can be decomposed further. This recursive process continues until the processes are simple enough to be implemented directly as code or configuration. The Level 1 diagram is the pivotal step that ensures the decomposition strategy is sound before diving into the minutiae of specific algorithms or database schemas.
📝 Summary of Differences
Level 0 and Level 1 Data Flow Diagrams serve distinct but complementary roles in systems analysis. Level 0 defines the system’s perimeter and its relationship with the external environment. Level 1 peels back the curtain to reveal the primary functional components and internal data handling. Together, they form a layered view that supports both strategic planning and tactical execution.
By adhering to the principles of balancing, consistent naming, and appropriate granularity, teams can leverage these diagrams to reduce ambiguity, align expectations, and build robust systems. Whether you are documenting a legacy application or designing a new architecture, mastering the distinction between these levels ensures clear communication and effective system modeling.