A Data Flow Diagram, often abbreviated as DFD, serves as a critical visual tool in systems analysis and design. It maps the flow of information through a system, illustrating how data moves from input to output. Unlike flowcharts that focus on control logic, a DFD concentrates on the movement of data itself. This distinction is vital for architects and analysts who need to understand the substance of a system without getting bogged down in the timing or conditions of execution.
Creating a DFD requires a structured approach. It is not merely about drawing shapes; it is about modeling the logic and data integrity of a process. Whether you are designing a new software application, auditing an existing workflow, or mapping business processes, a well-constructed diagram provides clarity. It helps stakeholders visualize the system boundaries and identify where data originates and where it is stored.
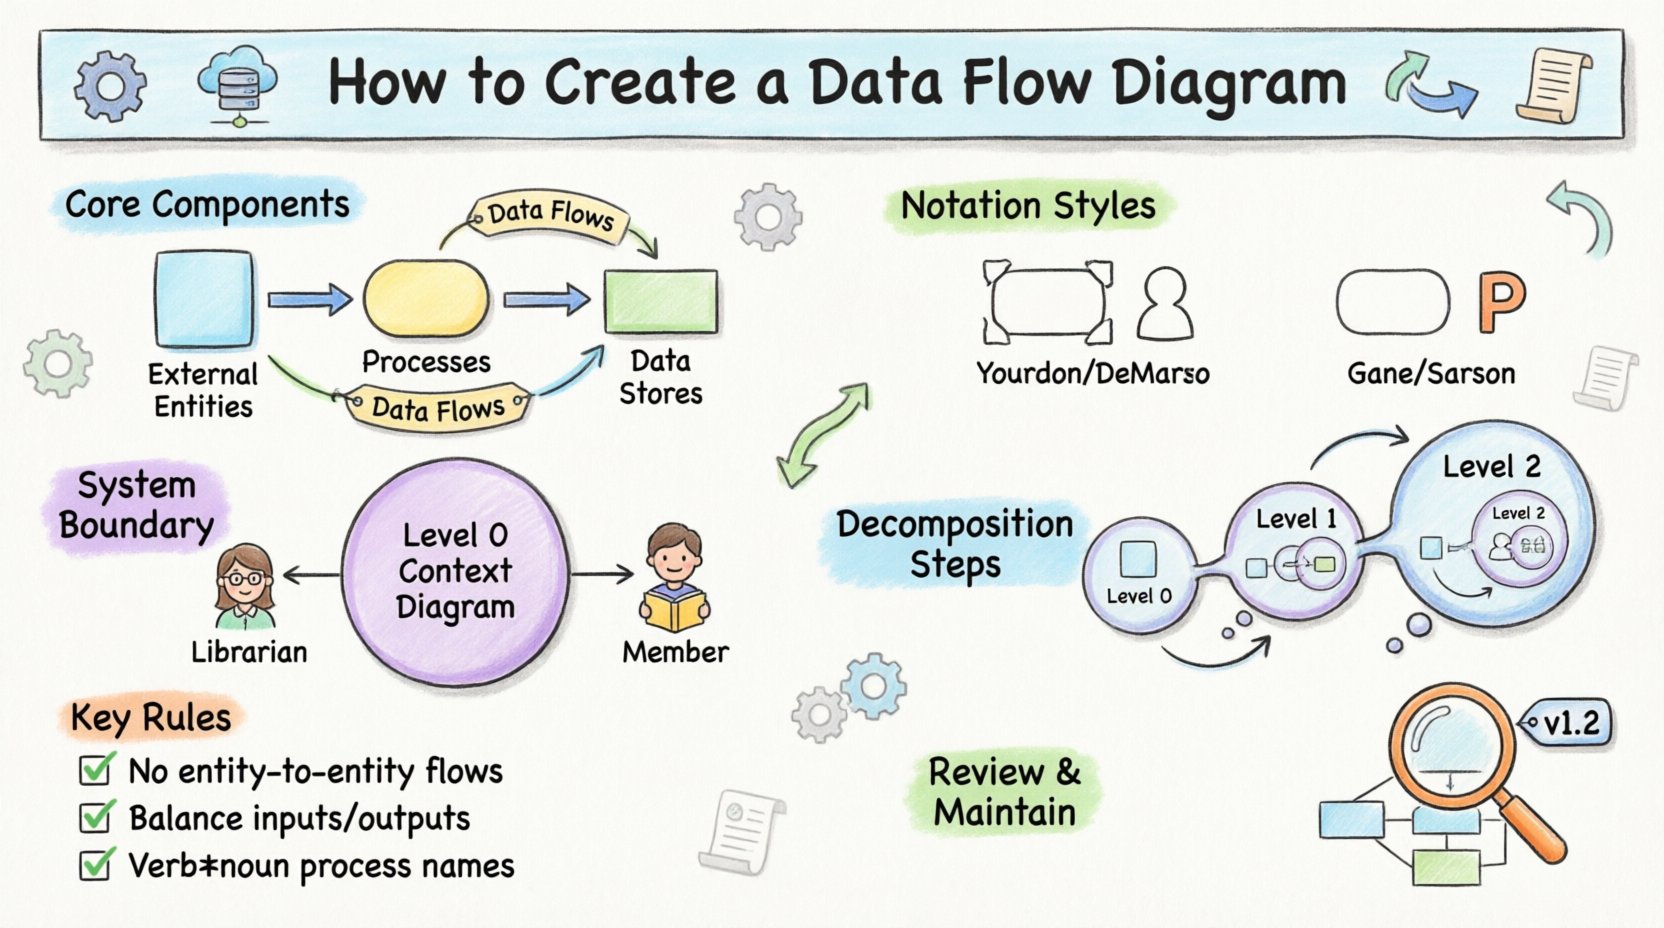
Understanding the Core Components 🧩
Before drawing lines and boxes, one must understand the fundamental building blocks. Every DFD consists of four primary elements. Recognizing these components ensures that the diagram remains consistent and readable.
- External Entities: These are the sources or destinations of data. They exist outside the system boundary. An entity could be a user, another system, or an organization. In diagrams, they are typically represented as squares or circles.
- Processes: This is where the action happens. Processes transform input data into output data. They represent work done on the data. A process must have at least one input and one output. They are usually drawn as rounded rectangles or circles.
- Data Stores: These represent where data is held for later use. They can be physical databases, filing cabinets, or even email inboxes. They do not initiate action but hold information. Data stores are often depicted as open-ended rectangles or parallel lines.
- Data Flows: These are the arrows that connect the components. They show the direction of data movement. Each arrow must be labeled with the name of the data being transferred.
It is important to note that data cannot move directly from one entity to another without a process in between, nor can it move from a data store to an entity without a process. These rules maintain the logical integrity of the model.
Choosing the Notation Style 🖊️
There are two primary methodologies for drawing DFDs. While they share the same underlying logic, their visual representation differs. Choosing the right one depends on the team’s preference or the specific industry standard.
| Feature |
Yourdon and DeMarco |
Gane and Sarson |
| Processes |
Rounded Circles |
Rounded Rectangles |
| Data Stores |
Open-ended Rectangles |
Open-ended Rectangles with thick sides |
| Data Flows |
Curved Arrows |
Curved Arrows |
| External Entities |
Rectangles |
Rectangles |
The Yourdon and DeMarco style is often associated with older methodologies, while Gane and Sarson is widely used in modern structured analysis. Regardless of the shape chosen, consistency is key. Mixing styles within a single document can confuse readers.
Defining the System Boundary 🚧
The first step in creating a diagram is to define the scope. You must determine what is inside the system and what is outside. This is often done by creating a Context Diagram, also known as a Level 0 DFD.
A Context Diagram represents the entire system as a single process. It shows the high-level interaction between the system and external entities. This provides a bird’s-eye view of the data entering and leaving the system. When drawing this, focus on the inputs and outputs only. Do not detail internal processes yet.
For example, consider a library system. The system is the single circle. External entities might include “Librarian” and “Member.” Data flows might include “Book Checkout Request” entering the system and “Loan Receipt” leaving it. This simple view sets the stage for more detailed breakdowns.
Breaking Down the Process 🔄
Once the context is established, the system needs to be decomposed. This process is called decomposition. It involves expanding the single process from the Context Diagram into multiple subprocesses. This creates a Level 1 DFD.
Decomposition requires care. You cannot simply add random processes. Each subprocess must handle specific data transformations. If a data flow enters a subprocess, it must result in a specific output. If data is stored, it must be connected to a data store.
Key Steps for Decomposition
- Identify Sub-processes: Look at the main process. What are the distinct tasks it performs? Break these tasks into separate circles or rectangles.
- Connect Data Stores: Determine where information is saved. If a task updates a record, draw a flow to the data store.
- Refine Data Flows: Ensure every arrow is labeled. The label should describe the data, not the action. For instance, use “Customer Order” rather than “Send Order”.
- Check Consistency: Ensure the data flows in the Level 1 diagram match the inputs and outputs of the parent process in the Level 0 diagram.
This process can continue. If a Level 1 process is too complex, it can be broken down further into a Level 2 DFD. This recursive breakdown allows analysts to zoom in on specific areas of concern without losing the overall context.
Rules for Drawing and Balancing ⚖️
There are strict rules that govern DFD construction. Violating these rules can render the diagram invalid. The most critical concept is “Balancing.”
Balancing means that the inputs and outputs of a parent process must match the inputs and outputs of its child processes. If a Level 0 process has an input of “Order,” the Level 1 diagram must show that same “Order” data entering one of the child processes. You cannot introduce new data at the lower level that was not present at the higher level, unless it is a logical detail.
Additional Drawing Rules
- No Data Flow Between Entities: Data must pass through a process. It cannot go directly from one external entity to another.
- No Data Flow Between Data Stores: Data stores hold static data. Movement between them requires a process to transform or move the data.
- No Data Flow into or out of a Data Store without a Process: A store cannot generate data or receive data on its own. A process must control the interaction.
- Process Naming: Name processes with a verb and a noun. This clarifies the action, such as “Calculate Tax” or “Update Inventory”.
- Data Flow Naming: Name flows with a noun phrase. This clarifies the content, such as “Invoice Details” or “Payment Confirmation”.
Review and Refine 🧐
Once the diagram is drafted, a review phase is essential. This involves checking for errors, omissions, and clarity issues. Stakeholders should review the diagram to ensure it matches their mental model of the system.
During this phase, look for dangling flows. These are arrows that lead nowhere. Every flow must connect to a process, store, or entity. Also, check for crossed lines. While not strictly forbidden, crossing lines can make the diagram hard to read. Try to route lines to avoid intersections.
Another aspect of review is the naming convention. Ensure that the same data is referred to by the same name throughout the diagram. If you call it “Customer ID” in one section, do not call it “Client Number” in another. Consistency aids comprehension.
Maintenance Over Time 🛠️
A DFD is not a one-time artifact. Systems evolve. Requirements change. As the system changes, the diagram must be updated to reflect the new reality. A stale diagram is worse than no diagram, as it misleads developers and analysts.
Establish a versioning system for your diagrams. When a significant change occurs, update the version number. This helps track the history of the system design. It also allows new team members to understand how the system has grown.
Integrating with System Analysis 📋
DFDs are rarely used in isolation. They are part of a larger documentation suite. They often accompany data dictionaries and process specifications. A data dictionary defines the attributes of the data elements found in the diagram. A process specification details the logic within a specific process bubble.
By combining these documents, you create a comprehensive specification. This documentation supports the development team in building the system. It ensures that the final product aligns with the initial analysis.
Conclusion on Diagramming Practices
Creating a Data Flow Diagram is a disciplined exercise in communication. It translates abstract requirements into a visual format that is easier to understand. By adhering to the standard components, notation styles, and balancing rules, you ensure that the diagram serves its purpose effectively.
Remember that the goal is clarity. If a stakeholder looks at the diagram and understands the system, the diagram has succeeded. If it requires explanation that contradicts the visual, the diagram needs revision. Focus on the flow of information, maintain consistency in notation, and keep the scope clear. With practice, constructing accurate and useful data flow diagrams becomes a natural part of the systems design process.