


Migrating from a monolithic architecture to a distributed microservices model is one of the most significant decisions a software engineering team can make. It is not merely a change in code structure; it is a fundamental shift in how systems interact, how data flows, and how teams operate. While many discussions focus on infrastructure or deployment pipelines, the architectural blueprint often remains vague until implementation begins. This is where communication diagrams provide essential clarity.
A communication diagram, often a variation of a UML sequence diagram, focuses on the objects and the messages exchanged between them. By visualizing these interactions, architects can identify hidden dependencies, define service boundaries, and anticipate integration challenges before a single line of code is written. This guide explores how to leverage these diagrams to navigate the complex journey from a single codebase to a distributed system.
🧩 Understanding the Monolith State
Before planning the transition, one must thoroughly understand the current state. A monolithic application is characterized by a single deployment unit where all components reside together. In this environment, communication is typically internal, often involving direct function calls or shared memory access.
- Tight Coupling: Components are interdependent. A change in one module can easily break another.
- Shared Database: Data is often stored in a single schema, making it difficult to partition data ownership.
- Linear Scaling: To handle increased load, the entire application must be replicated, even if only specific functions are under pressure.
- Unified Deployment: A change in any feature requires redeploying the entire system.
When mapping this to a communication diagram, the visual representation shows a dense network of connections. Every object can talk to every other object. This density is the primary technical debt that needs to be untangled.
🏗️ The Microservices Vision
Microservices architecture aims to decompose the application into smaller, independent services. Each service owns a specific business capability and manages its own data. The goal is loose coupling and high cohesion within service boundaries.
- Independent Deployment: Teams can release changes for specific services without affecting the whole system.
- Decentralized Data: Each service manages its own database schema, preventing shared state issues.
- Resilience: Failure in one service does not necessarily cascade to others if designed correctly.
- Scalability: Resources can be allocated specifically to the services that need them.
However, achieving this vision requires precise planning. The communication diagram becomes the tool to define where the boundaries lie. It helps answer the critical question: What should talk to what?
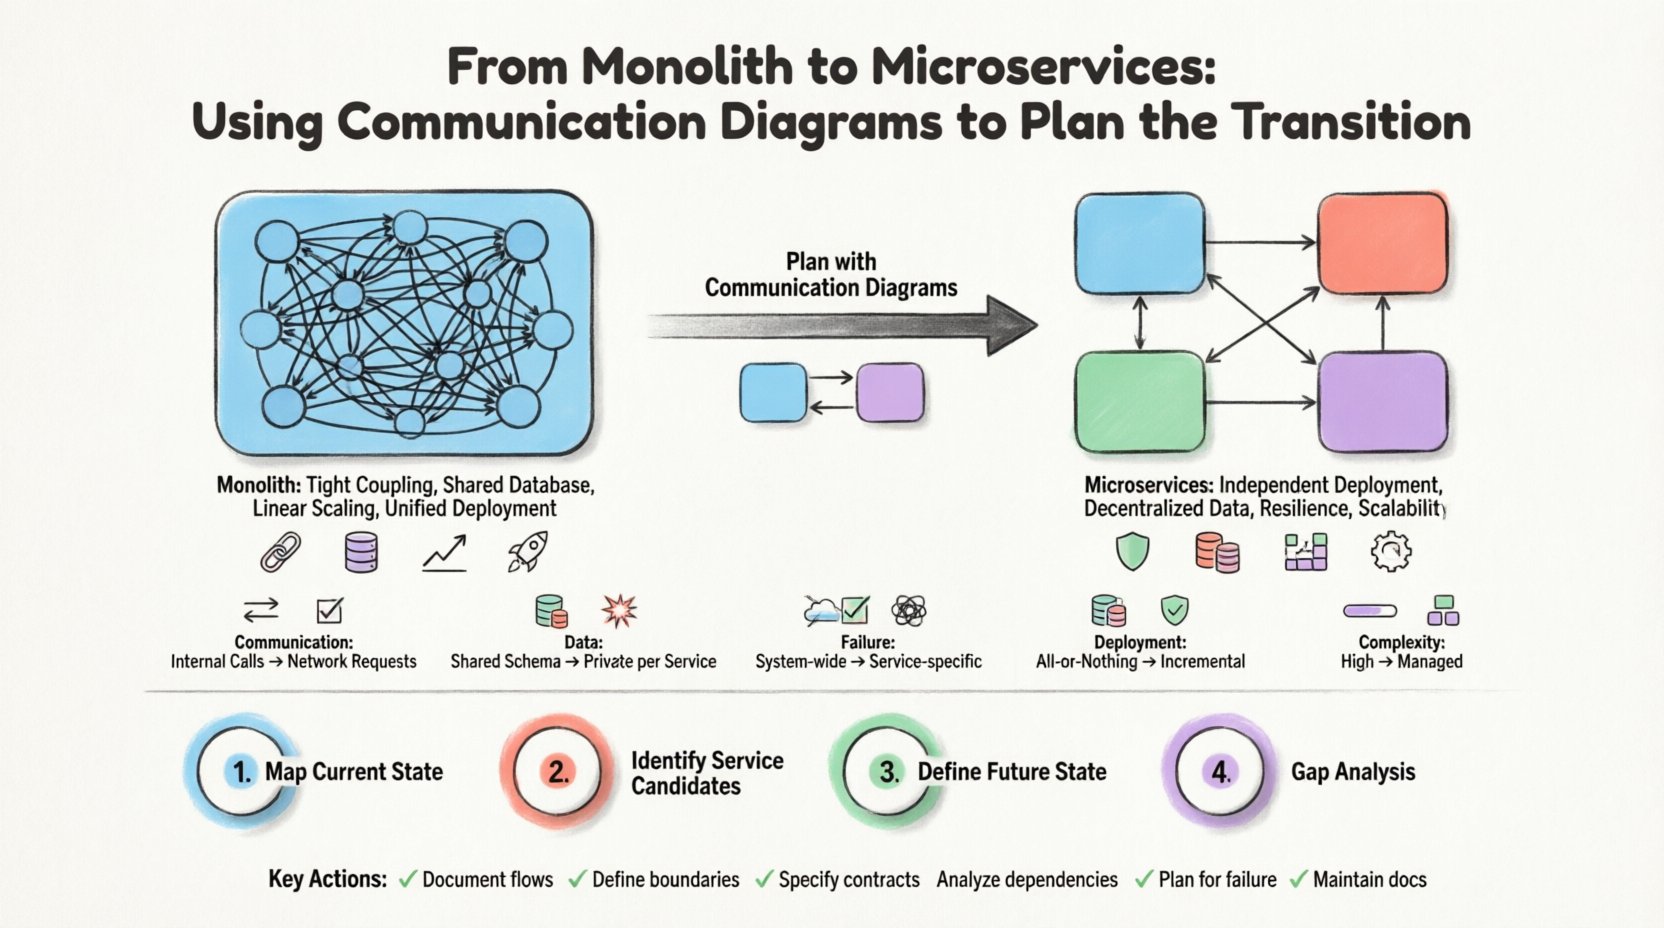
📊 Comparing Architectural States
To visualize the shift, we can compare the characteristics of the two states using a structured view.
| Feature | Monolith State | Microservices State |
|---|---|---|
| Communication | Internal Method Calls | Network Requests (HTTP/RPC) |
| Data Access | Shared Schema | Private Schema per Service |
| Failure Domain | System-wide | Service-specific |
| Deployment | All-or-Nothing | Incremental |
| Diagram Complexity | High (Many Connections) | Managed (Defined Boundaries) |
🎯 Why Communication Diagrams Are Critical
Sequence diagrams are common, but communication diagrams offer a distinct advantage for architectural planning. They emphasize the relationships between objects and the flow of messages without the strict vertical time-axis constraints of sequence diagrams. This makes them ideal for understanding the topology of interactions.
1. Identifying Coupling
In a monolith, coupling is invisible because everything is in one process. In a diagram, you can visually trace the message paths. If Service A sends a message to Service B, and Service B sends a message back to Service A for data it already has, you have identified a circular dependency. This is a red flag for microservices.
2. Defining Boundaries
Communication diagrams help you draw lines. By grouping objects that interact frequently into a single box, you define a service boundary. Objects outside this box should only interact via well-defined interfaces. This reduces the surface area for failure.
3. Visualizing Concurrency
Microservices introduce network latency. A communication diagram can show parallel message flows. Instead of waiting for one call to finish, multiple services might be triggered simultaneously. This helps in planning for asynchronous processing and eventual consistency.
🛠️ Step-by-Step Transition Planning
Planning the transition requires a methodical approach. The communication diagram acts as the central artifact throughout this process. Here is a structured workflow to follow.
Step 1: Map the Current State
Begin by documenting the existing monolith. Create a high-level communication diagram that represents the major functional areas. Do not get bogged down in every single class; focus on the business capabilities.
- Identify the core entry points (e.g., API endpoints).
- Trace the path of a typical user request through the system.
- Note where data is read and written.
- Highlight areas where complex logic is intertwined.
Step 2: Identify Service Candidates
Once the current flow is mapped, look for natural separations. Look for cohesive groups of functionality that can be separated without breaking the flow. Use the diagram to isolate these groups.
- Domain-Driven Design: Group objects by business domain (e.g., Billing, Inventory, User).
- Resource Ownership: Group objects that manage the same data entities.
- Frequency of Change: Group features that are updated at different rates.
Step 3: Define the Future State
Draw the target architecture. Create separate diagrams for each proposed service. Define the interfaces (contracts) that services will use to talk to each other. This is the most crucial step.
- Specify the message formats (Request/Response).
- Define error handling protocols.
- Identify required authentication and authorization checks.
- Document the data consistency requirements.
Step 4: Gap Analysis
Compare the current state diagram with the future state diagram. What interactions are lost? What new interactions are introduced? This analysis reveals the integration work required.
- Are there direct database calls that must become API calls?
- Are there shared libraries that need to be distributed?
- Are there transaction boundaries that need to change from local to distributed?
🔗 Managing Dependencies and Contracts
One of the biggest risks in a microservices transition is the creation of an “implicit contract” that breaks when services evolve. Communication diagrams force explicitness.
Contract-First Design
Before writing code, define the contract. In the diagram, this is the message signature. If Service A sends a “CreateOrder” message to Service B, the structure of that message must be agreed upon and documented.
Versioning Strategies
Services will change. The communication diagram should include notes on how changes are handled. Will the interface version be part of the URL? Will the message schema evolve via backward compatibility?
- URL Versioning: /v1/orders vs /v2/orders.
- Header Versioning: Accept-Version header.
- Schema Evolution: Adding optional fields to messages.
⚠️ Common Pitfalls to Avoid
Even with a diagram, teams often fall into traps during the transition. Being aware of these pitfalls can save significant time and effort.
Pitfall 1: Distributed Monolith
This occurs when services are physically separated but logically coupled. They still call each other synchronously in a tight chain, effectively replicating monolithic behavior. The communication diagram will show a long, linear chain of messages that must complete before the response is returned. This kills performance and resilience.
Pitfall 2: Over-Splitting
Creating too many small services increases complexity. If the diagram shows a service that only handles one small function and calls three other services to complete a task, the overhead might outweigh the benefits. Group functionality to keep the network hop count low.
Pitfall 3: Ignoring Asynchrony
Real-world systems are not always synchronous. A communication diagram that only shows request-response pairs misses the reality of event-driven architectures. Include asynchronous messages and event listeners in your planning.
🔄 Iterating on the Diagram
A communication diagram is not a one-time document. It is a living artifact that should evolve with the code.
- Review During Sprint Planning: When adding a new feature, update the diagram to show the new interactions.
- Use for Onboarding: New developers can understand the system flow by reading the diagrams.
- Use for Troubleshooting: When an error occurs, trace the message flow in the diagram to find the bottleneck.
📈 Technical Considerations for Implementation
As you move from planning to implementation, several technical factors come into play that the diagram should inform.
Network Latency
In a monolith, a function call takes nanoseconds. In a microservice architecture, a message takes milliseconds. The diagram should highlight where latency is acceptable and where it might cause issues. For example, a user-facing request should not wait on a slow background service.
Data Consistency
Distributed transactions are complex. The diagram should indicate where data needs to be consistent immediately and where eventual consistency is acceptable. This dictates whether you use a two-phase commit, sagas, or event sourcing.
Observability
When services talk over a network, you need to see the traffic. The communication diagram helps define what needs to be logged. Every message exchange should ideally be traceable via a correlation ID.
🤝 Aligning Teams with the Diagram
Architecture is not just about technology; it is about people. The communication diagram serves as a shared language between different teams working on different services.
- Service Owners: They own the box in the diagram and the messages entering/exiting it.
- Integration Teams: They ensure the connections between boxes work correctly.
- QA Teams: They use the diagram to create integration test cases that span multiple services.
When a change is proposed, the diagram shows which teams need to be consulted. If Service A changes its output format, Service B and any downstream services need to know. This prevents surprises.
🚀 Moving Forward
The transition from monolith to microservices is a journey, not a destination. It requires continuous refinement of boundaries and interfaces. Communication diagrams provide the visual structure needed to manage this complexity. By focusing on the messages and the relationships between components, teams can avoid the common pitfalls of distributed systems.
Start with the current state. Map the interactions. Identify the boundaries. Define the contracts. Iterate as the system evolves. This disciplined approach ensures that the resulting architecture is robust, scalable, and maintainable. The diagram is the map; the code is the vehicle. Ensure you have a clear map before you start the engine.
📝 Summary of Key Actions
- Document Current State: Capture the existing communication flows.
- Define Boundaries: Group related functionality into service units.
- Specify Contracts: Clearly define message formats and interfaces.
- Analyze Dependencies: Identify and reduce tight coupling.
- Plan for Failure: Design for network issues and timeouts.
- Maintain Documentation: Keep diagrams updated as the system changes.
By adhering to these practices, engineering teams can navigate the transition with confidence and clarity, ensuring that the architectural shift delivers the intended benefits without introducing unnecessary complexity.