


System design requires precision. When building complex software, understanding how objects interact is critical. A Communication Diagram offers a clear view of these interactions. It focuses on the flow of messages between objects rather than the strict timeline of events. This guide walks you through creating one from the ground up.
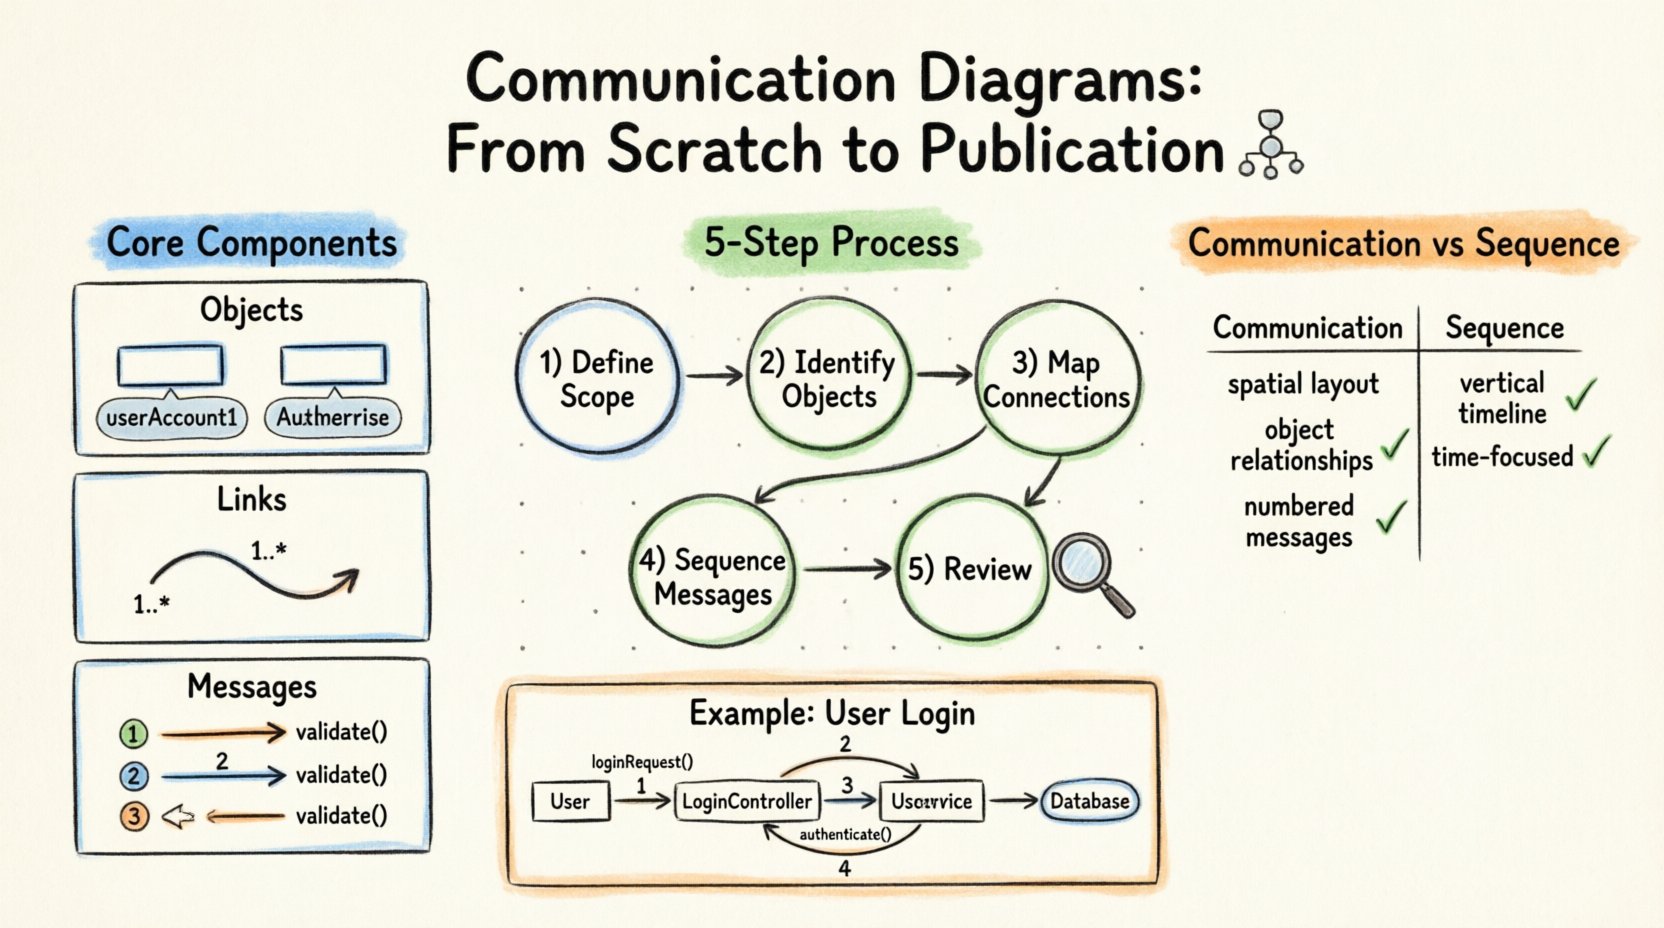
🧠 What is a Communication Diagram?
A Communication Diagram is a type of interaction diagram in the Unified Modeling Language (UML). It visualizes how different objects or components within a system exchange information. Unlike other diagrams that focus heavily on time, this format prioritizes the structural relationships and the order of messages.
- Focus: Interaction between objects.
- Visual Style: Objects placed spatially, linked by lines.
- Key Feature: Numbered arrows to show message sequence.
- Use Case: Describing a specific scenario or use case within the software.
It is often used by architects and developers to plan the logic before writing code. By mapping out these connections, you can identify potential bottlenecks or missing logic early in the development cycle.
🛠️ Core Components of the Diagram
Before drawing, you must understand the building blocks. Each element serves a specific purpose in conveying information.
1. Objects and Roles
Objects represent instances of classes or system components. In the diagram, they appear as rectangles. You can label them with the class name or specific role names.
- Instance Name: e.g., userAccount1
- Class Name: e.g., AuthenticationService
- Placement: Position them logically to reflect their relationship in the system.
2. Links
Links represent the associations between objects. They are solid lines connecting the rectangles. A link implies that one object can send messages to another.
- Direction: While the line is static, the message arrows indicate direction.
- Multiplicity: Some tools allow you to mark if a link represents a 1-to-1 or 1-to-many relationship.
3. Messages
Messages are the actions being performed. They are represented by arrows along the links. The arrow points from the sender to the receiver.
- Label: The name of the operation or function being called.
- Sequence Number: A number (1, 2, 3…) placed before the label to define order.
- Type: Can be synchronous (blocking) or asynchronous (non-blocking).
📝 Step-by-Step Guide to Drawing
Creating a diagram involves a logical progression. Follow these steps to ensure accuracy and clarity.
Step 1: Define the Scope and Actors
Start by identifying the external actors and the internal objects involved. Ask yourself: What is the trigger for this interaction?
- Is it a user clicking a button?
- Is it a scheduled background job?
- Is it an incoming API request?
Write down the primary actor. This is usually the starting point of your diagram.
Step 2: Identify the Objects
List the internal components required to handle the trigger. Do not include objects that are not directly involved in this specific scenario. Keep it focused.
- Database Connector
- Validation Service
- Notification Module
- Response Handler
Step 3: Map the Connections
Draw the links between the objects. Ensure that every object that needs to talk to another is connected. If an object is isolated, it cannot participate in the interaction.
Step 4: Sequence the Messages
This is the most critical step. Draw the arrows and assign numbers. The number represents the order of execution.
- Start: Number 1 is always the first message sent.
- Nesting: If an object calls another, and that second object calls a third, the numbers continue sequentially.
- Return Messages: You can show return values with dashed lines, though often these are implied.
Step 5: Review for Clarity
Look at the diagram. Can someone read it without asking questions? The visual flow should match the logical flow of the code.
📊 Communication Diagram vs. Sequence Diagram
Both diagrams show interactions, but they emphasize different aspects. Use a table to compare them.
| Feature | Communication Diagram | Sequence Diagram |
|---|---|---|
| Primary Focus | Object relationships and structure | Time and order of messages |
| Layout | Flexible spatial arrangement | Vertical timeline |
| Readability | Better for complex branching | Better for linear flows |
| Numbering | Required for order | Implicit via vertical position |
Choose the Communication Diagram when the structural relationship between objects is more important than the exact timing. Choose the Sequence Diagram when the timing and lifespan of objects are critical.
✅ Best Practices for Maintenance
Diagrams are documents. They must be maintained as the code evolves. A diagram that does not match the code is worse than no diagram at all.
- Keep it Simple: Avoid cluttering the canvas with too many objects. Break complex scenarios into multiple diagrams.
- Consistent Naming: Ensure object names in the diagram match the codebase.
- Version Control: Store diagram files alongside your code or in a dedicated documentation repository.
- Regular Audits: Review diagrams during sprint planning or code review sessions.
- Focus on Logic: Do not diagram every getter or setter. Focus on business logic flows.
🚫 Common Pitfalls to Avoid
Even experienced designers make mistakes. Be aware of these common errors.
1. Missing Return Messages
While not always mandatory, showing the return path can clarify error handling or data flow. If a method returns a value, consider indicating it.
2. Ambiguous Numbering
If you have parallel processes, ensure your numbering reflects the concurrency. Use sub-numbers (e.g., 1.1, 1.2) if actions happen simultaneously.
3. Over-Engineering
Do not diagram the entire system architecture in one file. Pick a specific use case. A diagram with 50 objects is hard to read and hard to maintain.
4. Ignoring Error States
Standard flows are easy to draw. Exception handling is often forgotten. Include paths for when a database connection fails or authentication is rejected.
🔍 Deep Dive: Message Types
Understanding the type of message helps in implementation.
- Call: The sender waits for a response. This is the default assumption.
- Signal: The sender does not wait. It fires and forgets.
- Return: The response back to the caller. Usually shown with a dashed arrow.
When drawing, use solid arrows for calls and signals. Use dashed arrows for returns. This visual distinction helps developers understand blocking behavior.
📈 From Draft to Publication
Once the diagram is drawn, it needs to be shared with the team. Here is how to finalize it.
- Export Options: Most editors allow exporting to PDF, PNG, or SVG. Choose the format based on where it will be viewed.
- Documentation Link: Embed the image in your project README or Wiki.
- Peer Review: Ask a colleague to trace the flow without looking at the code. If they get stuck, the diagram is unclear.
- Update Schedule: Set a reminder to update the diagram after major refactoring.
🧩 Example Scenario: User Login
Let us visualize a simple login process to solidify the concepts.
- Actor: User
- Object 1: LoginController
- Object 2: UserService
- Object 3: Database
The flow looks like this:
- User sends credentials to LoginController (1).
- LoginController requests user data from UserService (2).
- UserService queries Database (3).
- Database returns user data to UserService (4).
- UserService validates password and returns result to Controller (5).
- Controller sends login success message to User (6).
This linear flow is easy to map onto a Communication Diagram. Place the objects in a circle or a line. Draw the links. Number the arrows.
🛡️ Ensuring Accuracy
Accuracy is the currency of technical documentation. A wrong diagram leads to wrong code.
- Verify with Code: Do not guess. Check the actual class definitions.
- Check Dependencies: Ensure that if Object A calls Object B, Object A actually has a reference to Object B.
- Review Architectural Patterns: Ensure the diagram aligns with the chosen pattern (e.g., MVC, Microservices).
🔄 Iterative Improvement
Design is iterative. Your first diagram will not be perfect. Expect to redraw it.
- Refactor Layout: Move objects to reduce line crossing.
- Refactor Labels: Make message names more descriptive.
- Refactor Scope: Split the diagram if it becomes too large.
This process of refinement is normal. It leads to better understanding of the system. Do not fear changing the drawing. It is a tool for thinking, not just for presentation.
📚 Resources for Further Learning
To deepen your knowledge, explore the following areas.
- UML Specification: Read the official definitions of interaction diagrams.
- System Design Patterns: Study common patterns like Singleton or Factory to understand how they interact.
- Code Review Practices: Learn how diagrams are used in modern code review workflows.
Building a Communication Diagram is a skill that improves with practice. It forces you to think about connections and data flow. Over time, you will find yourself visualizing these diagrams mentally before you even open the drawing tool.
🏁 Final Summary
This guide has covered the essentials of creating a Communication Diagram. You now know the components, the steps, and the best practices. Use these tools to improve your system design.
- Start with a clear scope.
- Identify objects and links accurately.
- Number messages to define order.
- Review and maintain regularly.
By following these guidelines, you can produce diagrams that are valuable assets for your development team. They bridge the gap between abstract requirements and concrete code implementation.