


Designing systems that scale requires more than just writing code; it requires a clear vision of how different components interact. In the world of distributed systems, where services operate independently yet must coordinate seamlessly, visualizing these interactions is critical. Communication diagrams provide a structured way to map out these relationships, offering a topological view of how data flows between services. This guide explores the mechanics, application, and strategic value of communication diagrams in the context of modern API design and microservices architecture.
🏗️ Core Concepts of Communication Diagrams
A communication diagram, often associated with Unified Modeling Language (UML), serves as a structural description of a system. Unlike other diagramming methods that focus heavily on time sequencing, this approach emphasizes the structural organization of objects and the messages they exchange. In a microservices context, these “objects” translate to distinct services, APIs, or gateways. The primary goal is to illustrate the relationships and interactions without getting bogged down in the strict chronological order found in sequence diagrams.
When architects and developers utilize this notation, they focus on the following key aspects:
- Structural Relationships: How services are connected physically or logically.
- Message Flow: The direction and nature of data transmission between endpoints.
- Responsibility: Which service is responsible for handling specific requests.
- Collaboration: How multiple services work together to fulfill a single user request.
This method allows teams to see the big picture of the ecosystem. It highlights dependencies that might otherwise remain hidden in code repositories. By mapping the communication paths early, teams can identify bottlenecks, potential single points of failure, and areas where redundancy is necessary.
🔍 Anatomy of a Microservices Communication Diagram
To create an effective blueprint, one must understand the specific elements that constitute the diagram. Each symbol and line carries specific meaning regarding the state and interaction of the system components. Below are the fundamental building blocks used in this visualization.
1. Objects and Roles
Every box in the diagram represents a specific entity within the architecture. In microservices, these are typically:
- API Gateway: The entry point that routes traffic.
- Service Instance: A specific backend function or module.
- Client Application: The frontend or external system initiating the call.
- Database: The persistent storage layer associated with a service.
2. Links and Associations
Lines connecting these objects represent the communication channels. These are not merely connections; they define the protocol and trust level between the services. A link implies that a direct interaction is possible. In a distributed environment, this might represent an HTTP endpoint, a gRPC channel, or a message queue subscription.
3. Messages
Messages are the arrows placed on top of the links. They denote the action being taken. Each message should be labeled clearly to indicate the type of operation, such as GET /users or POST /order. The label helps distinguish between synchronous requests and asynchronous events.
📊 Comparison: Communication Diagram vs. Sequence Diagram
Confusion often arises between communication diagrams and sequence diagrams. Both describe interactions, but they serve different analytical purposes. Understanding when to use which is vital for accurate documentation and design.
| Feature | Communication Diagram | Sequence Diagram |
|---|---|---|
| Focus | Object structure and topology | Time-ordered flow of messages |
| Layout | Flexible, spatial arrangement | Vertical timeline, strict ordering |
| Best For | Overview of system connections | Complex logic and timing details |
| Message Count | Can show many messages easily | Can become cluttered with many messages |
| Readability | Good for high-level architecture | Good for specific transaction flows |
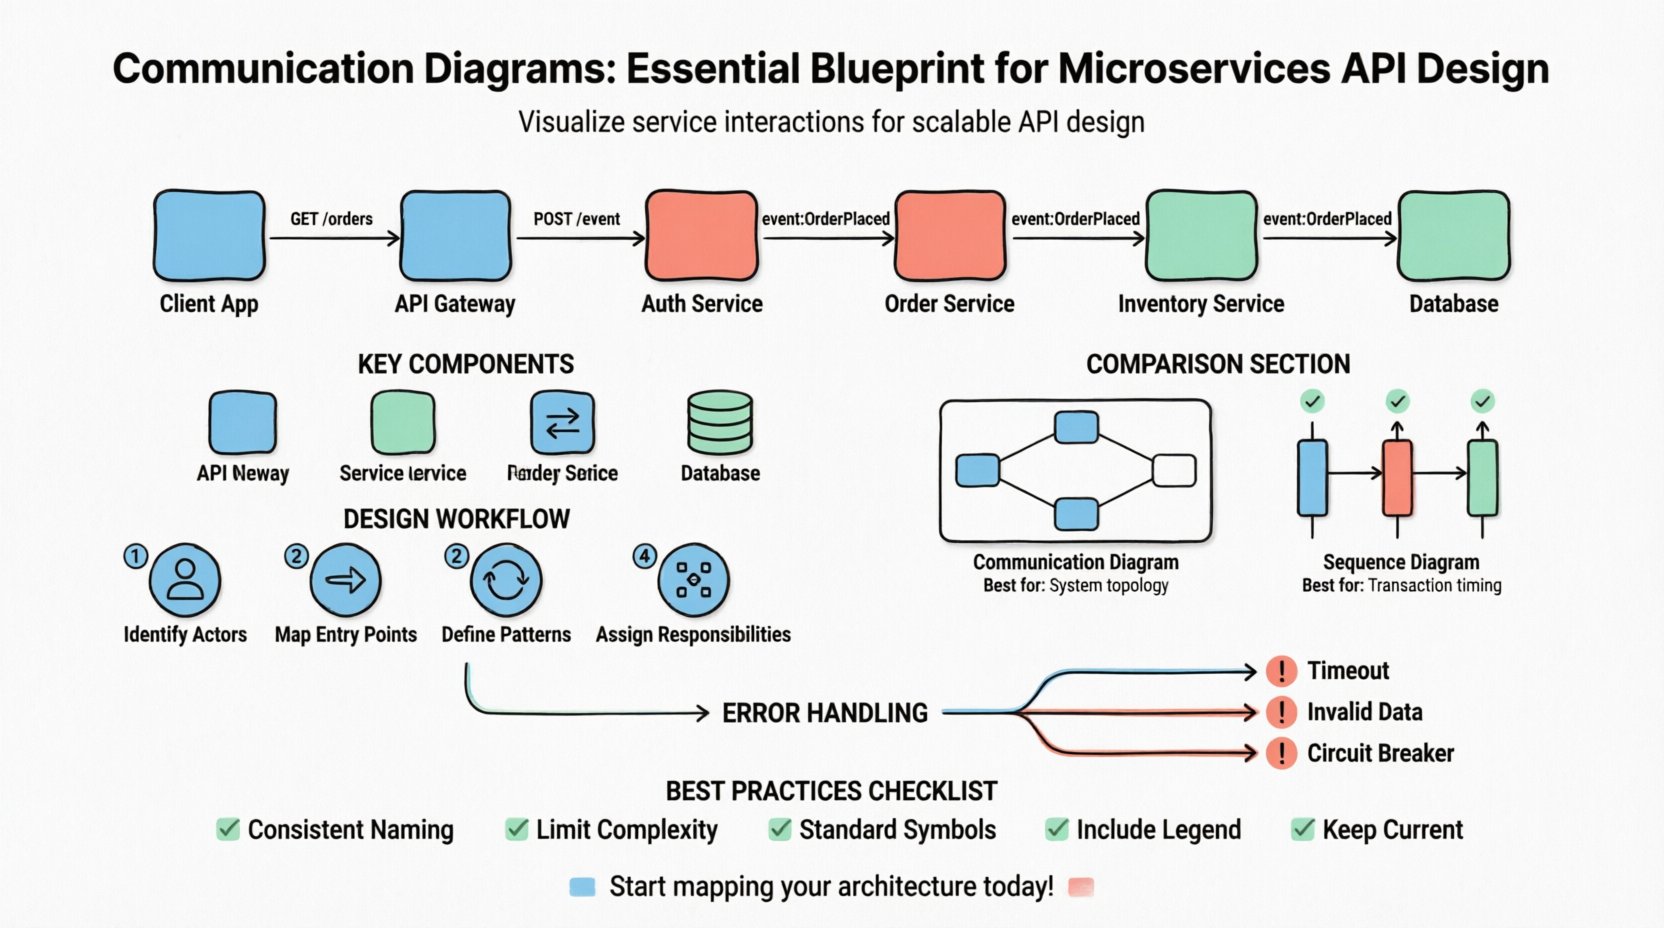
For API design, the communication diagram is often preferred during the initial architectural phase. It helps teams understand the network of dependencies. Once the topology is settled, a sequence diagram might be used to detail the specific logic of a complex transaction.
🛠️ Designing APIs Using Communication Diagrams
Applying this diagrammatic approach to API design transforms abstract requirements into concrete structural plans. Here is a step-by-step approach to integrating these diagrams into your development workflow.
Step 1: Identify the Actors
Start by listing every external and internal actor. This includes mobile clients, web browsers, third-party vendors, and internal background workers. Each actor should be represented as an object in the diagram.
Step 2: Map the Entry Points
Define where the traffic enters the system. Is there a single API Gateway, or do services connect directly? Mapping the entry points clarifies the security boundary and load balancing strategy.
Step 3: Define Interaction Patterns
For every interaction, define the pattern:
- Synchronous Request-Response: The client waits for the immediate return of data.
- Asynchronous Fire-and-Forget: The client sends a message and continues processing.
- Event-Driven: One service emits an event that triggers multiple listeners.
Step 4: Assign Responsibilities
Clearly label which service handles which part of the business logic. If a request involves user authentication, data retrieval, and payment processing, the diagram should show the handoff between the Auth Service, Data Service, and Payment Service.
⚠️ Handling Errors and Exceptions
A robust API design must account for failure. Communication diagrams are not just for happy paths; they are essential for visualizing how the system reacts when things go wrong. Failure modes should be represented as alternative message flows branching off the main path.
Consider the following scenarios when drawing error paths:
- Timeout: What happens if a downstream service does not respond within the threshold?
- Invalid Data: How does the upstream service reject malformed input?
- Service Unavailable: What is the fallback mechanism if a dependency is down?
- Circuit Breaking: How does the system prevent cascading failures?
By drawing these fallback paths, teams can ensure that error handling is not an afterthought. It ensures that every service knows its role when the primary flow is interrupted. This visual documentation aids in debugging and reduces the mean time to resolution (MTTR) during incidents.
🚀 Scalability and Performance Considerations
As the number of services grows, the complexity of the communication diagram increases. This complexity can impact performance if not managed correctly. The diagram serves as a tool to audit scalability before code is written.
When reviewing the diagram for scalability, look for these indicators:
- Hub-and-Spoke Patterns: Avoid a central service that handles all traffic for all other services. This creates a bottleneck.
- Chained Dependencies: Ensure that a single request does not traverse too many services in a linear chain. Each hop adds latency.
- Redundancy: Check if critical paths have multiple routes available for load distribution.
- Data Consistency: Visualize where data is replicated and where it is stored centrally.
If the diagram shows a service connected to five other services for every single request, it is a signal to introduce caching or to redesign the API boundary. The visual representation makes these structural anti-patterns obvious immediately.
🔄 Lifecycle and Evolution of the Diagram
Software architecture is not static. Services are deprecated, new features are added, and infrastructure changes. A communication diagram that is accurate today may be obsolete tomorrow. Maintaining the integrity of this blueprint is an ongoing task.
Versioning the Diagram
Just like API versions, diagrams should be versioned. A change in the underlying infrastructure, such as moving from a monolithic database to a distributed one, warrants a diagram update. This ensures that documentation remains a source of truth for new team members.
Automating Documentation
Manual updates lead to drift between the diagram and the actual code. Where possible, generate diagrams from the codebase using automated tools. This reduces the maintenance burden and ensures that the visual representation matches the implementation.
Review Cycles
Integrate diagram reviews into the standard design review process. Before a major pull request is merged, the architectural impact should be visualized. If a new service is being introduced, the diagram must be updated to reflect the new connections.
🤝 Collaboration and Team Alignment
One of the greatest benefits of using communication diagrams is the clarity they bring to cross-functional teams. Developers, product managers, and operations staff often have different mental models of the system. A standardized visual language bridges these gaps.
During planning sessions, the diagram acts as a focal point. It allows stakeholders to point to specific interactions and ask questions like, “What happens if this service is slow?” or “Does this change affect the client?” This shared context reduces miscommunication and ensures that everyone is working from the same architectural vision.
📝 Best Practices for Documentation
To get the most value out of these diagrams, adhere to specific standards for clarity and consistency. Poorly drawn diagrams can be more confusing than no diagrams at all.
- Consistent Naming: Use the same names for services in the diagram as in the codebase. Avoid abbreviations that might not be understood by all team members.
- Limit Complexity: If a diagram becomes too crowded, break it down. Create sub-diagrams for specific domains, such as “Authentication Flow” or “Payment Processing”.
- Use Standard Symbols: Stick to standard UML notation for arrows and objects to ensure universal understanding.
- Include Context: Add a legend explaining the symbols used, especially if custom icons are employed for specific infrastructure components.
- Keep it Current: Archive old versions. Do not delete them, but mark them as deprecated so the current version is immediately identifiable.
🧩 Real-World Application Scenarios
Consider a scenario where an e-commerce platform is being redesigned. The goal is to decouple the inventory system from the order system. A communication diagram helps visualize the shift from a direct database call to an event-based notification.
Initially, the diagram might show the Order Service calling the Inventory Service synchronously. After the refactor, the diagram updates to show the Order Service publishing an “OrderPlaced” event. The Inventory Service subscribes to this event. This visual shift clearly communicates the architectural change to the entire team. It highlights the removal of the tight coupling and the introduction of eventual consistency.
Similarly, in a multi-tenant system, the diagram can illustrate how tenant isolation is handled. It can show whether the tenant ID is passed as a header, a token, or a query parameter, and how the routing service uses this information to direct traffic to the correct resource pool.
🔒 Security Implications in Design
Security is often an afterthought in diagramming, but it should be integrated into the blueprint. Communication diagrams provide a surface to map authentication and authorization boundaries.
Key security elements to visualize include:
- Authentication Points: Where is the token validated?
- Authorization Checks: Where is the permission verified?
- Data Encryption: Where does data transition from plain text to encrypted transport?
- Rate Limiting: Where are the throttling mechanisms applied?
By marking these points on the diagram, security audits become more efficient. Auditors can trace the path of data from entry to storage and verify that every required check is in place. This proactive approach prevents security gaps that are often discovered too late in the development cycle.
🛑 Common Pitfalls to Avoid
While powerful, these diagrams are prone to misuse if not approached with discipline. Avoid the following common mistakes:
- Over-Engineering: Do not diagram every single method call. Focus on the service-to-service boundaries. Implementation details belong in code comments, not architecture diagrams.
- Ignoring State: Ensure the diagram acknowledges state changes. A service is not just a black box; it has a lifecycle.
- Static Representation: Do not treat the diagram as a static artifact. It must evolve with the system.
- Lack of Legend: Never assume everyone knows what a specific arrow style means. Define your notation.
📈 Summary and Next Steps
Communication diagrams offer a robust framework for visualizing the complex interactions inherent in microservices architecture. They provide a structural view that complements the temporal view of sequence diagrams, giving architects a comprehensive toolset for design. By focusing on relationships, message flows, and error handling, teams can build systems that are not only functional but also maintainable and scalable.
Adopting this practice requires an initial investment in learning the notation and setting up standards. However, the long-term benefits in reduced technical debt, clearer communication, and faster onboarding for new developers are substantial. As your system grows, the diagram will remain a vital artifact, guiding the evolution of your API design and ensuring that the architecture continues to meet the demands of the business.
Start by mapping your current system. Identify the critical paths. Look for the bottlenecks. Use the diagram to plan the next iteration. This disciplined approach to visualization is a cornerstone of professional software engineering.