


Introduction
In today’s rapidly evolving business landscape, understanding how information moves through your systems isn’t just helpful—it’s essential. Data Flow Diagrams (DFDs) have emerged as the gold standard for visualizing complex data movements, yet traditional diagramming methods remain time-consuming and error-prone. What if you could transform a simple text description into a professional-grade DFD in minutes rather than hours?

This comprehensive guide explores everything you need to know about Data Flow Diagrams—from fundamental concepts and industry-standard notations to advanced decomposition techniques. More importantly, we’ll discover how Visual Paradigm’s revolutionary AI-powered features are transforming the way analysts, architects, and developers create DFDs. By leveraging artificial intelligence, you can now automate the tedious aspects of diagram creation while maintaining complete control over your models [[12]].
Whether you’re a business analyst documenting legacy systems, a software architect designing new platforms, or a student learning systems analysis, this guide will equip you with the knowledge and tools to create professional DFDs that communicate complex information with crystal clarity.
What is a Data Flow Diagram?

Also known as DFD, Data Flow Diagrams are graphical representations that illustrate how data flows through a business information system. DFDs describe the processes involved in transferring data from input sources to file storage and report generation, providing a visual map of information movement.
Data flow diagrams are categorized into two distinct types:
-
Logical Data Flow Diagrams: These describe the flow of data through a system to perform specific business functions, focusing on what the system does rather than how it does it.
-
Physical Data Flow Diagrams: These describe the implementation details of the logical data flow, showing how the system will actually be constructed.
Why Use DFDs?
DFDs graphically represent the functions or processes that capture, manipulate, store, and distribute data between a system and its environment, as well as between system components. This visual representation makes DFDs an excellent communication tool between users and system designers.
Key Benefits:
-
Logical Information Flow: Clearly maps how data moves through the system
-
Requirements Determination: Helps identify physical system construction requirements
-
Simplicity of Notation: Uses straightforward, easy-to-understand symbols
-
System Planning: Establishes both manual and automated system requirements
-
Hierarchical Structure: Allows starting from a broad overview and expanding into detailed diagrams
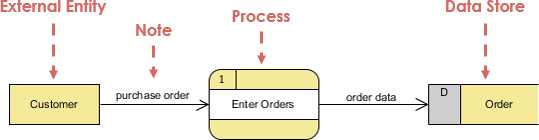
DFD Symbols: The Building Blocks
There are four basic symbols used to represent data-flow diagrams. Mastering these symbols is essential for creating effective DFDs.
1. Process
A process receives input data and produces output with different content or form. Processes can range from simple tasks like collecting input data and saving it to a database, to complex operations like generating monthly sales reports for all retail stores in a region.
Naming Convention:
Every process has a name that identifies its function, consisting of a verb followed by a singular noun.
Examples:
-
Apply Payment
-
Calculate Commission
-
Verify Order
Notation:
-
A rounded rectangle represents a process
-
Processes are given IDs for easy referencing

Process Example:
2. Data Flow
A data flow is a path for data to move from one part of the information system to another. A data flow may represent a single data element (such as Customer ID) or a set of data elements (a data structure).
Examples:
-
Customer_info (LastName, FirstName, SS#, Tel #, etc.)
-
Order_info (OrderId, Item#, OrderDate, CustomerID, etc.)
Data Flow Example:

Notation:
-
Straight lines with incoming arrows represent input data flow
-
Straight lines with outgoing arrows represent output data flows
Important Note: Because every process changes data from one form into another, at least one data flow must enter and one data flow must exit each process symbol.
Rules of Data Flow:
One fundamental rule for developing DFDs is that all flows must begin with and end at a processing step. This is logical because data cannot transform on its own without being processed. Using this rule makes it easy to identify and correct illegal data flows.
| Wrong | Right | Description |
|---|---|---|
 |
 |
An entity cannot provide data to another entity without processing occurring. |
 |
 |
Data cannot move directly from an entity to a data store without being processed. |
 |
 |
Data cannot move directly from a data store without being processed. |
 |
 |
Data cannot move directly from one data store to another without being processed. |
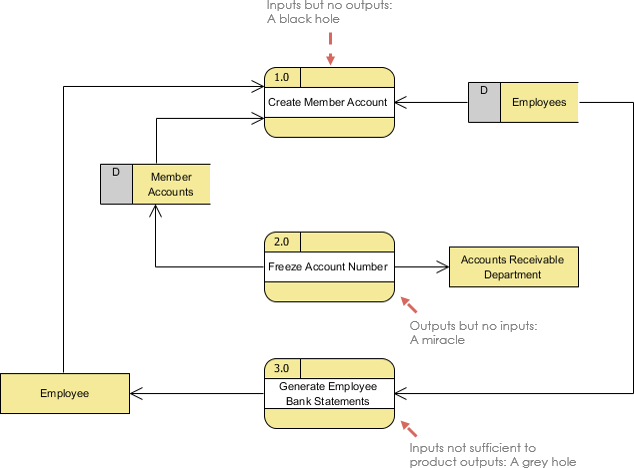
Common DFD Mistakes:
A second class of DFD mistakes arises when outputs from one processing step don’t match its inputs:
-
Black Holes: A processing step has input flows but no output flows
-
Miracles: A processing step has output flows but no input flows
-
Grey Holes: A processing step has outputs greater than the sum of its inputs
3. Data Store
A data store (or data repository) represents a situation where the system must retain data because one or more processes need to use the stored data at a later time.
Notation:
-
Data can be written into a data store, represented by a flow connector from the ‘writer’ to the data store
-
Data can be read from a data store, represented by a flow connector from the data store to the ‘reader’
-
Examples include Inventory, Accounts Receivable, Orders, and Daily Payments

Data Store Example:

Important Notes:
-
A data store must be connected to a process with a data flow
-
Each data store must have at least one input data flow and at least one output data flow (even if the output is a control or confirmation message)
4. External Entity
An external entity is a person, department, outside organization, or other information system that provides data to the system or receives outputs from the system. External entities exist outside the boundaries of the information system and represent how the system interacts with the outside world.
Characteristics:
-
Represented by a rectangle
-
Either supply data or receive data
-
Do not process data
Notation:
-
A customer submitting an order and receiving a bill from the system
-
A vendor issuing an invoice

External Entity Example:

Important Notes:
-
External entities are also called “terminators” because they are data origins or final destinations
-
An external entity must be connected to a process through a data flow
Top-Down Decomposition Techniques
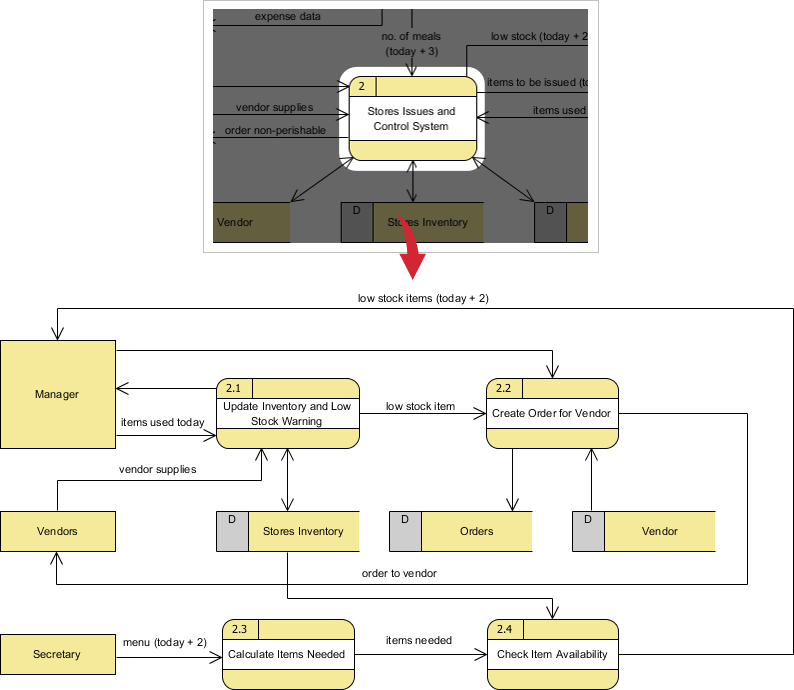
Top-down decomposition, also called leveling, is a technique used to show more detail in lower-level DFDs. Leveling involves drawing a series of increasingly detailed diagrams until the desired degree of detail is reached.
As shown in the figure below, DFD leveling starts by displaying the targeted system as a single process, then progressively showing more detail until all processes are functional primitives.
Balancing DFD
When performing top-down decomposition to create lower-level DFDs, inputs and outputs must be conserved between levels. For example, Level n and Level n+1 must have the same inputs and outputs.

Guidelines for Developing Data Flow Diagrams
Context Diagram (Level 0)
-
Must fit on one page
-
The process name should be the name of the information system (e.g., Grading System, Order Processing System, Registration System)
-
Gets the number 0 (Level Zero)
Unique Naming Conventions
-
Use unique names within each set of symbols
-
For example, there can be only one entity named CUSTOMER across all levels, or only one process named CALCULATE OVERTIME
Avoid Cross Lines
-
Restrict the number of processes in a DFD to prevent crossing lines
-
Maintain clarity and readability
Optimal Complexity: 7 ± 2 Symbols
-
On lower-level DFDs with multiple processes, don’t exceed nine process symbols
-
To avoid crossing lines, duplicate external entities or data stores using special notation (such as an asterisk) to denote duplicates
Numbering Convention
-
Use unique reference numbers for each process symbol
-
Follow hierarchical numbering:
-
Level 1: (1, 2, 3, …)
-
Level 2: (1.1, 1.2, 1.3, …, 2.1, 2.2, 2.3, …)
-
Level 3: (1.1.1, 1.1.2, 1.1.3, …)
-
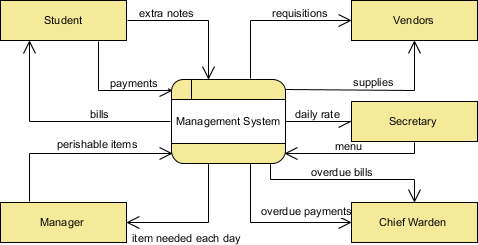
Context-Level Diagram Details
A context diagram provides an overview and represents the highest level in a DFD, containing only one process representing the entire system.
Characteristics:
-
All external entities are shown along with major data flows to and from them
-
Contains no data stores
-
The single process can be exploded into major processes in the next level (Diagram 0)
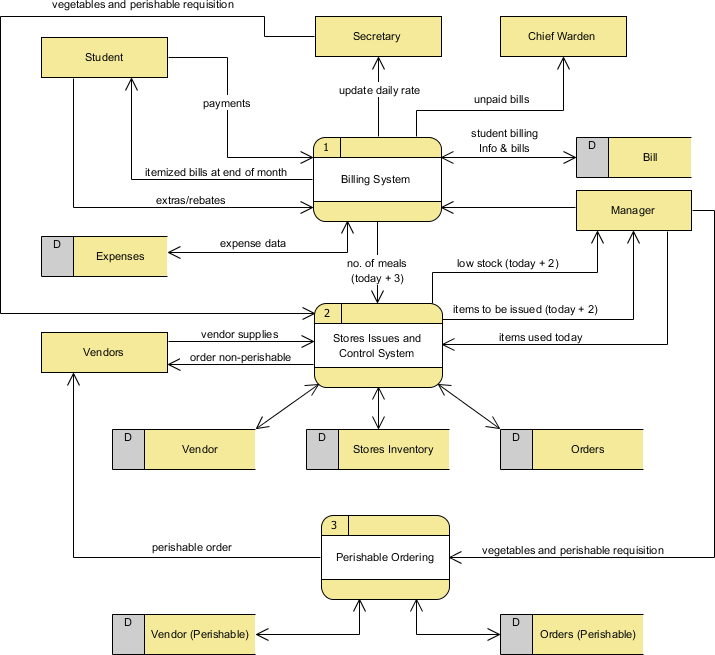
Level 1 DFD
Processes in Diagram 0 (with whole numbers) can be exploded further to represent details of processing activities.
Note: Although a Level 1 DFD may have only a few processes, numerous inputs and outputs between processes and external entities can create crossing lines. To avoid this, use multiple views (master and auxiliary view) of the same external entity.
Level 2 DFD
If a process has extensive data flow linking several external entities, extract that process and associated entities into a separate diagram (similar to a context diagram) before refining it into a separate DFD level. This ensures easier consistency management.
Logical vs. Physical Data Flow Diagrams
Data flow diagrams are categorized as either logical or physical, each serving distinct purposes in system development.
Logical Data Flow Diagrams
A logical DFD focuses on the business and how it operates, without concern for how the system will be constructed. It ignores implementation specifics such as computer configuration, data storage technology, or communication methods, instead focusing on functions like data collection, transformation, and reporting.
Benefits of Logical DFDs:
-
Business-Centered: Drawn from present business information and centered on business activities, making it ideal for communicating with project users
-
Technology-Independent: Based on business events and independent of particular technology, making the resulting system more stable
-
Better Understanding: Allows analysts to understand the business and identify the reasons behind implementation plans
-
Easier Maintenance: Systems based on logical DFDs are easier to maintain because business functions don’t change frequently
-
Simplicity: Often contains fewer data stores (just files or databases), making it less complex and easier to develop
-
Foundation for Physical DFDs: Physical DFDs can be easily formed by modifying logical DFDs
Physical Data Flow Diagrams
A physical DFD shows how the system will be implemented, including hardware, software, files, and people. It ensures that processes described in logical DFDs are implemented correctly to achieve business goals.
Benefits of Physical DFDs:
-
Clarifies Automation: Distinguishes between manual and automated processes
-
Detailed Processing: Describes all steps for data processing in greater detail than logical DFDs
-
Sequencing: Shows processes that must be done in a particular order
-
Temporary Storage: Identifies temporary data storage needs
-
Actual Names: Specifies actual file names and printouts for programmer reference
-
Controls: Adds validations and conditions for data input, updates, and deletions
Refining Physical DFDs from Logical DFDs
Example: Grocery Store Cashier System
Scenario:
-
The CUSTOMER brings ITEMS to the register
-
PRICES for all ITEMS are LOOKED UP and totaled
-
PAYMENT is given to the cashier
-
The CUSTOMER receives a receipt
Logical DFD Example – Grocery Store
The logical DFD illustrates processes without detailing physical implementation:

Physical DFD Example – Grocery Store
The physical DFD adds implementation details:
-
Uses bar codes (UPC PRICE codes) found on grocery items
-
Mentions manual processes like scanning
-
Explains temporary files for keeping subtotals
-
Specifies payment methods: CASH, CHECK, or DEBIT CARD
-
Refers to the receipt by its actual name: CASH REGISTER RECEIPT

Revolutionizing DFD Creation with Visual Paradigm’s AI Features
From Text to Diagram in Minutes
Traditional DFD creation required hours of manual labor, meticulous shape placement, and constant adjustments. Visual Paradigm has transformed this process with its AI-powered DFD generator, which converts plain English descriptions into sophisticated, logically structured diagrams instantly [[12]].
How the AI DFD Generator Works
Visual Paradigm’s AI engine understands your requirements and can generate professional diagrams from natural language descriptions [[12]]. Here’s how it works:
Step 1: Describe Your System
Write a 200-word description of the business process you want to model. For example: “Generate a Data Flow Diagram to visualize how data moves through an online shopping system where customers place orders, the system validates payment against customer databases, and administrators manage the product catalog.”
Step 2: Select Diagram Type and Notation
Choose “Data Flow Diagram” from the diagram type dropdown and select your preferred notation style:
-
Gane-Sarson (popular in information systems)
-
Yourdon & Coad (common in software engineering)
-
Yourdon DeMarco
-
Standard notation
Step 3: Specify the Level
Indicate whether you need:
-
Level 0 (Context Diagram): High-level overview showing the entire system as one process
-
Level 1: Detailed breakdown of major processes
-
Level 2: Further decomposition of complex processes
Step 4: Let AI Work Its Magic
The AI parses your text, identifies key components:
-
External entities (actors)
-
Processes (actions that transform data)
-
Data flows (paths data takes)
-
Data stores (where data is held)
Step 5: Review and Refine
The generated diagram opens directly in Visual Paradigm’s editor, ready for refinement. Because it’s a native diagram, you can easily:
-
Rename elements
-
Add new data flows
-
Adjust layout
-
Decompose processes into lower levels
Key AI Features
1. Instant Visualization
Transforms natural language descriptions into professional-grade diagrams in seconds, reducing first-draft creation time from 45 minutes to under 10 minutes [[10]].
2. Intelligent Decomposition
The AI can automatically suggest decompositions for high-level processes, creating Level 1 and Level 2 diagrams with one click based on proven modeling heuristics [[10]].
3. Multiple Notation Support
Supports all industry-standard DFD notation styles, allowing you to choose the format that best fits your organization’s standards.
4. Automated Layout
Handles automatic layout and readability, ensuring flow lines don’t cross unnecessarily and the diagram maintains professional appearance.
5. Full Editability
The output is a native Visual Paradigm diagram, allowing complete manual refinement and scaling.
6. Consistency Checking
Built-in validation ensures logical consistency, preventing common errors like black holes, miracles, and grey holes.
Practical Implementation
Using Visual Paradigm’s AI modeling for real-world scenarios—from e-commerce checkout flows to hospital patient admission systems—has proven that the AI generates drafts requiring only minor human oversight [[10]].
The workflow:
-
Write a clear description of the business process
-
Upload to the AI DFD generator via Tools > AI Diagram Generation
-
Let the AI extract actors, processes, data flows, and stores
-
Review and refine using built-in consistency checks
-
Generate additional levels with one click
Advanced Capabilities
Integration with Other Models:
DFDs created with AI can be linked to other Visual Paradigm models:
-
Use Case Diagrams
-
Entity Relationship Diagrams (ERD)
-
Class Diagrams
-
Sequence Diagrams
This creates a cohesive, traceable requirements set that maintains consistency across all system documentation.
Team Collaboration:
Visual Paradigm Cloud allows your entire team to design, review, and comment on AI-generated diagrams simultaneously, with versioning that tracks every change and allows reverting to any previous state.
Conclusion
Data Flow Diagrams remain an indispensable tool for visualizing how information moves through business systems. From the foundational symbols—processes, data flows, data stores, and external entities—to advanced decomposition techniques and the distinction between logical and physical models, mastering DFDs equips you with a powerful communication tool for system analysis and design.
However, the landscape of DFD creation has fundamentally changed. What once required hours of meticulous manual work can now be accomplished in minutes with Visual Paradigm’s AI-powered features. By simply describing your system in natural language, you can generate professional, standards-compliant DFDs that serve as excellent starting points for detailed system modeling [[12]].
The combination of traditional DFD principles with modern AI capabilities offers the best of both worlds: the rigor and clarity of established modeling techniques, enhanced by the speed and intelligence of artificial intelligence. Whether you’re documenting existing systems, designing new platforms, or communicating requirements to stakeholders, this powerful combination enables you to create clearer, more accurate diagrams in less time than ever before.
As systems grow increasingly complex, the ability to quickly visualize and communicate data flows becomes ever more critical. By leveraging both the foundational knowledge outlined in this guide and the cutting-edge AI tools available in Visual Paradigm, you’re equipped to tackle any DFD challenge with confidence and efficiency.
References
- Best DFD Modeling Tool: Professional DFD editor with AI-powered generation capabilities for creating data flow diagrams faster and more efficiently.
- Try Visual Paradigm FREE: Download Visual Paradigm to experience AI-powered visual modeling, including instant DFD generation from text descriptions.
- New Diagram Types Added to AI Diagram Generator: DFD & ERD: This release announcement details the expanded capabilities of the AI generator, which now includes support for the automated creation of Data Flow Diagrams (DFD).
- Mastering AI-Driven Systems Engineering: A Comprehensive Guide to ArchiMate and SysML Diagram Generation: This case study demonstrates how Visual Paradigm’s AI-powered chatbot improves efficiency in system modeling and specifically highlights its role in data flow diagram creation.
- Visual Paradigm’s AI Diagram Generator Expands Instant Creation Capabilities: This article explores how the AI generator has been updated to support the instant creation of DFDs and other models to streamline information flow analysis.
- AI Textual Analysis – Transform Text into Visual Models Automatically: This feature overview describes how AI analyzes text documents to automatically generate various visual models, facilitating faster documentation and modeling for business and software systems.
- AI Diagram Generator Supports 13 Diagram Types: An official update noting that the AI diagram generator now supports 13 different diagram types, providing enhanced modeling flexibility for architects and developers.
- How to Create Data Flow Diagram (DFD)? – Visual Paradigm: A foundational tutorial that explains how to visually depict data movement through system processes, which serves as the basis for AI-driven generation and refinement.
- Demystifying Information Flow with DFDs: A comprehensive guide that explains the conceptual framework of DFDs and how they are used to model information movement across various system components.
- Mastering Data Flow Diagrams with Visual Paradigm: An in-depth guide that explores advanced modeling tools and best practices for creating complex DFDs within a professional software environment.
- Data Flow Diagram Templates – Visual Paradigm: This resource provides a library of ready-to-use DFD templates that visualize how data moves within business information systems, aiding in rapid prototyping.
- Unlock the Power of Data Flow Diagrams (DFD) with Visual Paradigm: This guide discusses the comprehensive ecosystem provided for DFD modeling, emphasizing its role in efficient design and team collaboration.
- Ready to transform your systems analysis workflow? Explore Visual Paradigm’s AI-powered DFD tools and discover how quickly you can turn complex requirements into professional diagrams.