


Designing complex systems requires more than just knowing what they do; it requires understanding when they do it. This is where the State Diagram becomes an essential tool for engineers and architects. A state diagram, often referred to as a state machine diagram, visually represents the dynamic behavior of a system. It maps out the conditions under which a system operates and how it reacts to specific events.
Whether you are modeling a simple vending machine or a distributed cloud infrastructure, clarity is paramount. This guide explores the standard notations used in the industry, specifically focusing on UML (Unified Modeling Language) and MSC (Message Sequence Charts). We will break down symbols, syntax, and best practices to help you build diagrams that communicate intent without ambiguity.
🧩 What is a State Machine Diagram?
A state machine diagram models the life cycle of an object or a system component. It answers fundamental questions:
- What are the distinct conditions (states) the system can be in?
- What triggers a change from one condition to another (transitions)?
- What happens when a change occurs (actions)?
- What is the starting point, and what signifies the end?
Unlike a flowchart, which focuses on the flow of data or control through a process, a state diagram focuses on the state of the entity. This distinction is vital for systems that have memory or persistent status, such as an authentication system, a traffic light controller, or a network protocol.
🔍 UML State Machine Notation: The Standard
The Unified Modeling Language (UML) is the most widely adopted standard for modeling software systems. Version 2.x of UML refined the state machine diagram to handle more complex scenarios. Understanding the core elements of UML notation is the first step toward mastery.
1. The Core Elements
Every state diagram relies on a few foundational components. These are the building blocks you will use repeatedly.
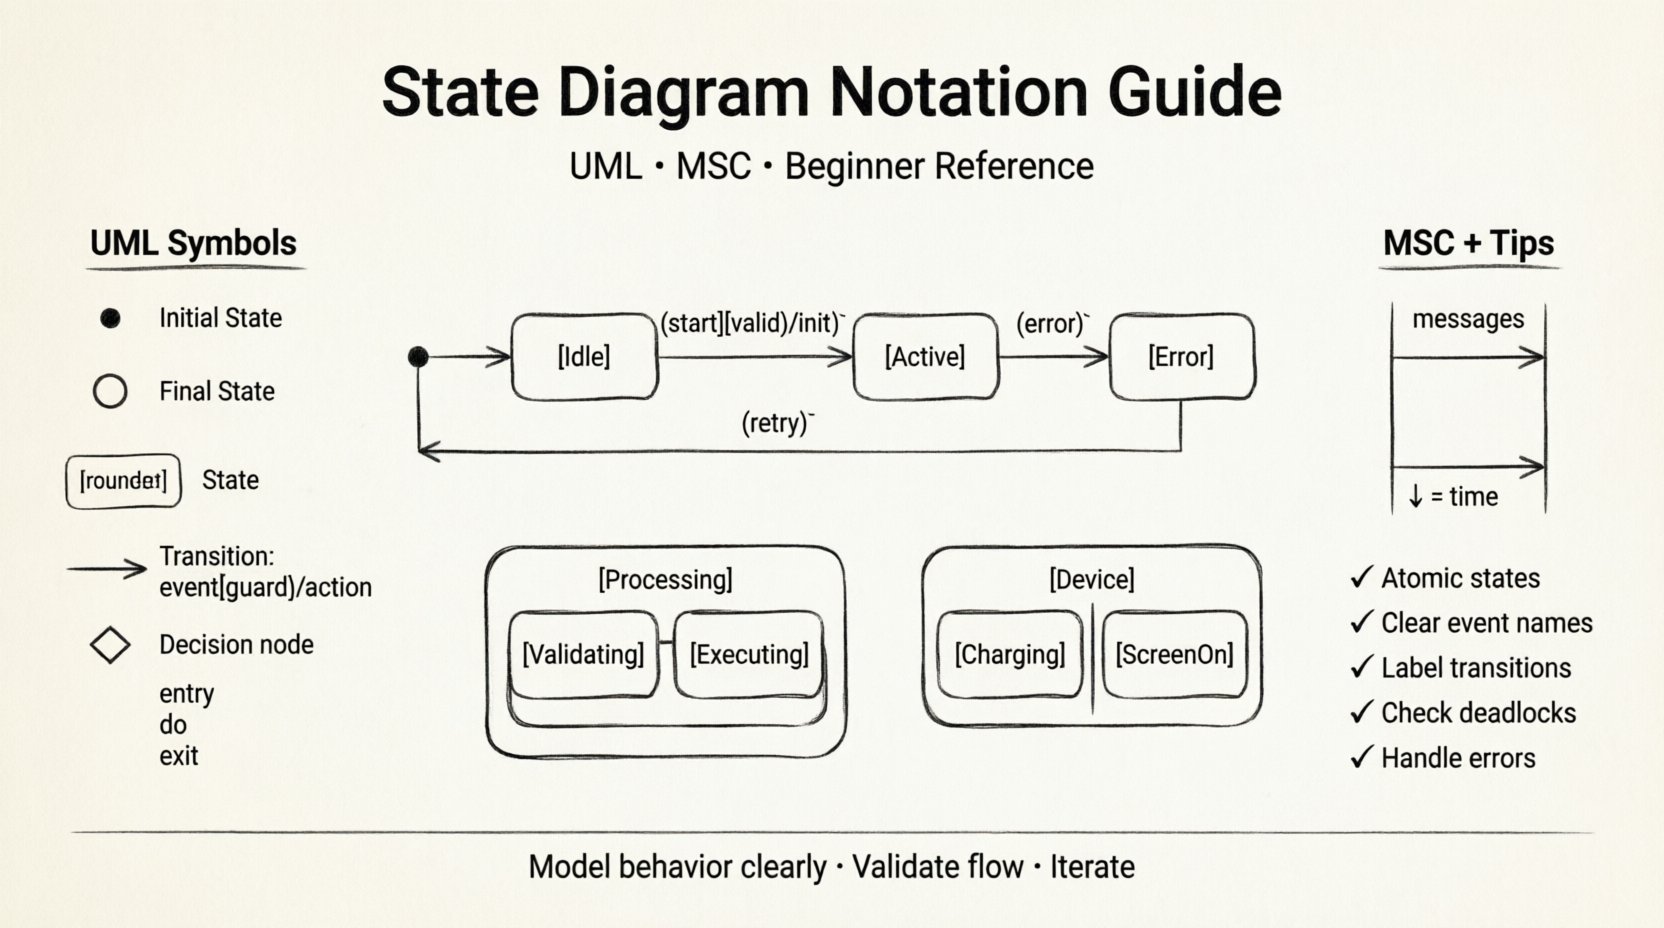
- State: Represented by a rectangle with rounded corners. It denotes a condition during which an object satisfies some invariant, performs some activity, or waits for an event.
- Transition: A directed line connecting two states. It indicates that the system moves from one state to another in response to an event.
- Event: The trigger that initiates a transition. It can be a signal, a time event, or a call.
- Guard Condition: A boolean expression enclosed in square brackets
[ ]. The transition only occurs if this condition is true. - Action: An activity performed during a transition or while in a state. It is often denoted after a slash
/.
2. Entry and Exit Points
States are not static; they have lifecycles. When a state is entered, specific actions occur. When it is exited, others happen. UML notation captures this lifecycle clearly.
- Entry Action (entry /): Executes immediately upon entering the state.
- Do Activity (do /): Executes while the state remains active. This is useful for continuous processes, like a motor spinning or a timer running.
- Exit Action (exit /): Executes immediately before leaving the state.
For example, in an Online Shopping Cart scenario, entering the Processing state might trigger an entry / validate_stock() action. While in this state, the system might perform a do / update_inventory() loop. Upon exiting, it might trigger an exit / send_confirmation().
3. Initial and Final States
Every diagram needs a clear beginning and end. These are represented by specific shapes to distinguish them from regular states.
- Initial State: A filled black circle. This is the starting point of the system. There can be only one initial state per diagram.
- Final State: A black circle surrounded by a circle outline (bullseye). This indicates the end of the system’s lifecycle. A state machine can have multiple final states.
📡 MSC: Message Sequence Charts
While UML focuses on the state of a single object or component, MSC (Message Sequence Charts) focuses on the interaction between multiple objects over time. They are often used together or in conjunction with state diagrams to provide a complete picture.
MSC notation is particularly useful for:
- Visualizing the order of messages exchanged between components.
- Identifying timing constraints and delays.
- Showing parallel processes.
In an MSC, vertical lines represent instances (objects), and horizontal arrows represent messages. The vertical axis represents time flowing downwards. This complements the state diagram by showing who sent the event that triggered the state change.
🛠 Notation Comparison Table
To make the distinctions clearer, here is a breakdown of common symbols and their meanings across standard modeling notations.
| Symbol Shape | Name | UML Meaning | Common Usage |
|---|---|---|---|
| ● (Filled Circle) | Initial Point | Start of the state machine | Always the first node |
| ◎ (Bullseye) | Final Point | End of the state machine | Termination of process |
| ⬜ (Rounded Rectangle) | State | Current condition of the object | Describes status (e.g., Open, Closed) |
| ➡️ (Arrow) | Transition | Change from one state to another | Connects states |
| ◀ (Diamond) | Decision Node | Branching based on conditions | Guard conditions evaluation |
| ⬤ (Small Filled Circle) | History State | Re-entry to previous state | Jumping back to where you left off |
| 🔗 (Link) | Join | Merge of parallel flows | Combining concurrent states |
🚀 Advanced UML Concepts
Once you understand the basics, you can model more sophisticated behaviors using advanced UML features. These concepts allow for hierarchy and concurrency, which are necessary for real-world systems.
1. Nested States (Substates)
Complex states often contain sub-states. For instance, a Vehicle state might contain sub-states like EngineOn, EngineOff, and IgnitionKeyIn. This is known as state hierarchy. When the parent state is active, the child states are active. This reduces diagram clutter and shows relationships clearly.
2. Orthogonal Regions (Concurrency)
A single object can be in multiple states simultaneously if those states are orthogonal. This is represented by dividing a state box into separate regions with a solid line. For example, a Smartphone can be in the Charging state while simultaneously being in the ScreenOn state. These regions run in parallel.
3. Pseudostates
Pseudostates are not true states but control points that help manage flow. They are often drawn with a specific symbol but do not represent a condition the system rests in.
- Deep History: Re-enters the state to the last active sub-state.
- Shallow History: Re-enters the state to the initial sub-state.
- Fork: Splits one transition into multiple concurrent transitions.
- Join: Waits for multiple concurrent transitions to complete before proceeding.
📝 Best Practices for Beginners
Creating a diagram is one thing; creating a good diagram is another. Follow these guidelines to ensure your work is readable and maintainable.
- Keep States Atomic: A state should represent a single coherent condition. Avoid putting complex logic inside a state name.
- Use Consistent Naming: Adopt a convention for naming states (e.g., always capitalized) and transitions (e.g., verb-based).
- Limit Transition Complexity: If a transition has too many guard conditions, consider splitting it into multiple transitions or states.
- Avoid Cross-References: Try to keep transitions local to the current state. Long-range jumps to distant states can confuse the reader.
- Label Events Clearly: Ensure event names are descriptive. Instead of
e1, useuser_login_attempt. - Document Actions: Don’t just draw the line; document the action on the line. What data is passed? What is updated?
⚠️ Common Mistakes to Avoid
Even experienced modelers make errors. Being aware of common pitfalls can save you time during reviews.
- Deadlocks: Ensure every state has a valid path to an exit or another state. A state with no outgoing transitions (other than final) is a potential deadlock.
- Unreachable States: Check that every state is reachable from the initial state. If a state is isolated, it implies a bug in the design.
- Missing Error Handling: Real systems encounter failures. Ensure your diagram accounts for error events and transitions to error or recovery states.
- Over-Engineering: Don’t model every possible edge case immediately. Start with the happy path and add complexity iteratively.
🔗 Beyond UML: Harel Statecharts
Before UML became the standard, David Harel introduced Statecharts. Many features in UML State Machines are derived directly from Harel’s work. If you encounter legacy documentation, you may see:
- AND-States: Similar to UML orthogonal regions.
- Exclusive-OR States: A group of states where only one can be active.
Understanding these origins helps when reading older technical specifications or working with specific domain-specific modeling languages that predate UML 2.x.
🛡️ Security and State Modeling
State diagrams are also critical for security analysis. By mapping out the states of an authentication system, you can identify:
- States where sensitive data is accessible.
- Transitions that might allow privilege escalation.
- States that lack proper validation guards.
For example, in a payment gateway, ensuring that the Pending state cannot transition directly to Completed without a Success event is a security requirement. Visualizing this flow makes it easier to audit.
📌 Summary of Key Takeaways
- State diagrams model the dynamic behavior of systems over time.
- UML provides the standard notation for states, transitions, and events.
- MSC complements state diagrams by showing interaction sequences.
- Pseudostates and nested states allow for complex, hierarchical modeling.
- Clear naming and logical flow are more important than complex graphics.
- Always validate for deadlocks and unreachable states before implementation.
Mastering these notations takes practice. Start with simple systems, apply the rules, and gradually increase complexity. The goal is not to create perfect diagrams, but to create diagrams that reduce ambiguity and improve communication within your team.
Remember, the value of a diagram lies in its ability to be read and understood by others. Keep it clean, keep it consistent, and keep the focus on the behavior you are trying to define. With these tools in your toolkit, you are well-equipped to tackle system modeling challenges.