


Business strategy requires more than intuition; it demands a structured understanding of market dynamics. When advising clients on market positioning or profitability, the Porter’s Five Forces Analysis remains a foundational framework. However, static analysis is insufficient. Modern consulting demands competitive benchmarking that integrates this model with real-world data to drive actionable strategy. This guide details how to apply these forces rigorously to identify leverage points, assess industry attractiveness, and formulate robust defensive and offensive strategies.
By deconstructing industry structure through this lens, consultants can move beyond surface-level observations. We will explore how to evaluate supplier leverage, buyer bargaining power, the threat of substitution, the intensity of rivalry, and the barriers to entry. Each section includes specific metrics and qualitative indicators to guide your assessment process.
Understanding the Framework 🔍
Developed by Michael Porter, this framework assesses the competitive intensity and attractiveness of a market. It shifts the focus from just current competitors to the broader ecosystem of industry participants. For a consultant, the goal is to determine the underlying profitability drivers and where value is captured or eroded.
Effective benchmarking using this model involves comparing a client against industry peers across these five dimensions. It reveals structural weaknesses and opportunities that generic SWOT analysis might miss.
Key Objectives of the Analysis
- Identify Profitability Drivers: Determine which forces exert the most pressure on margins.
- Assess Structural Change: Track how the forces evolve over time (e.g., technology reducing barriers).
- Strategic Positioning: Locate where the client fits relative to competitors.
- Risk Mitigation: Anticipate threats before they impact financial performance.
Deep Dive: The Five Forces 💪
To execute a thorough analysis, each force must be examined individually. Below is a breakdown of how to evaluate each component, including specific indicators for benchmarking.
1. Bargaining Power of Suppliers 🏭
Supplier power dictates the cost structure and supply chain reliability. When suppliers are strong, they can raise prices or reduce quality, squeezing the industry’s profitability.
Assessment Criteria
- Concentration: How many suppliers exist relative to buyers? A monopoly or oligopoly increases power.
- Switching Costs: Is it expensive or technically difficult for the client to change providers?
- Differentiation: Are the inputs unique, or are they commoditized?
- Threat of Forward Integration: Can suppliers enter the buyer’s industry directly?
Benchmarking Metrics
| Indicator | Low Supplier Power | High Supplier Power |
|---|---|---|
| Number of Suppliers | Many alternatives | Few alternatives |
| Input Differentiation | Standardized goods | Specialized technology |
| Switching Costs | Low | High |
| Supplier Concentration | Fragmented market | Consolidated market |
2. Bargaining Power of Buyers 👥
Buyer power influences price sensitivity and demand for quality. Powerful buyers can demand lower prices, higher service levels, or better features, directly impacting revenue.
Assessment Criteria
- Volume: Do buyers purchase in large quantities relative to the seller’s total sales?
- Price Sensitivity: Is the product a significant portion of the buyer’s cost structure?
- Switching Costs: How much friction exists for the buyer to change vendors?
- Threat of Backward Integration: Can buyers produce the product themselves?
Strategic Leverage
When buyer power is high, clients must focus on differentiation or switching cost creation. If the product is commoditized, cost leadership becomes the only viable defense. Benchmarking here involves analyzing contract terms, churn rates, and negotiation cycles across the industry.
3. Intensity of Competitive Rivalry 🥊
This force measures the aggressiveness of existing competitors. High rivalry leads to price wars, increased marketing spend, and reduced industry profitability.
Assessment Criteria
- Number of Competitors: A crowded market increases friction.
- Industry Growth Rate: Slow growth forces firms to fight for market share.
- Exit Barriers: High fixed costs or regulatory hurdles make leaving difficult, keeping supply high.
- Product Homogeneity: Similar products lead to price-based competition.
Benchmarking Rivalry
To benchmark rivalry, look at industry-wide metrics such as advertising intensity as a percentage of revenue, capacity utilization rates, and average price trends. If competitors are cutting prices while volumes remain flat, rivalry is intense.
4. Threat of Substitution 🔄
Substitutes are products from outside the industry that fulfill the same need. They place a ceiling on prices. A high threat limits the industry’s pricing power.
Assessment Criteria
- Relative Price/Performance: Is the substitute cheaper or better?
- Switching Propensity: How easy is it for customers to adopt the alternative?
- Emerging Technologies: Are new innovations disrupting the traditional model?
Examples of Substitution
- Transportation: Video conferencing substitutes business travel.
- Entertainment: Streaming services substitute physical media.
- Energy: Renewables substitute fossil fuels.
Consultants must scan adjacent industries for potential substitutes, not just direct competitors. This requires broad market intelligence.
5. Threat of New Entrants 🚪
New competitors bring capacity, aggression, and a desire for market share. The threat depends on barriers to entry.
Assessment Criteria
- Capital Requirements: High initial investment deters entry.
- Regulatory Hurdles: Licenses and compliance costs.
- Access to Distribution: Can new players reach customers effectively?
- Brand Loyalty: Is the incumbent established with strong customer retention?
- Proprietary Technology: Patents or trade secrets.
Competitive Benchmarking Methodology 📏
Once the forces are understood, the next step is benchmarking. This involves comparing the client’s position against industry peers to identify gaps and best practices.
Step 1: Define the Peer Group
- Select direct competitors with similar business models.
- Include indirect competitors if they influence customer expectations.
- Consider global vs. regional peers based on market scope.
Step 2: Data Collection Strategy
Gathering data without proprietary software requires diligence. Sources include:
- Public Financial Reports: Annual reports, 10-K filings, and earnings calls.
- Industry Publications: Trade journals and market research reports.
- Customer Feedback: Reviews, testimonials, and social sentiment.
- Regulatory Filings: Patent databases and compliance records.
- Primary Research: Interviews with industry experts or former employees.
Step 3: Quantitative Scoring
Create a scoring matrix for each force. Assign a score from 1 (Low Impact) to 5 (High Impact) based on the data gathered. This allows for a visual comparison between the client and the industry average.
Translating Analysis into Strategy 🚀
Analysis without action is merely observation. The consultant’s value lies in synthesizing these findings into a coherent strategic plan.
Developing Defensive Strategies
If the forces are hostile, the client must build defenses.
- Against Supplier Power: Diversify the supplier base or negotiate long-term contracts.
- Against Buyer Power: Increase switching costs through loyalty programs or integrated services.
- Against Rivalry: Focus on niche segments where competition is lower.
- Against Substitution: Innovate continuously to stay ahead of alternatives.
- Against New Entrants: Build economies of scale and secure exclusive distribution channels.
Developing Offensive Strategies
When forces are favorable, the client can exploit opportunities.
- Acquisition: Buy competitors to consolidate power.
- Expansion: Enter new geographic markets where rivalry is lower.
- Pricing: Leverage low supplier power to undercut rivals.
Common Pitfalls in Application ⚠️
Even experienced strategists make errors when applying this framework. Awareness of these pitfalls ensures the integrity of the recommendation.
1. Static Analysis
Markets change. A force that is weak today may be strong tomorrow. The analysis must include a timeline view, assessing how forces are trending.
2. Ignoring the Ecosystem
Focusing only on direct competitors misses substitution threats. Always look at adjacent industries for disruptive potential.
3. Over-Reliance on Historical Data
Past financial performance does not guarantee future profitability. Structural changes often precede financial shifts.
4. Generic Recommendations
Advice must be tailored. “Reduce costs” is not a strategy. “Reduce costs by renegotiating supplier contracts due to high switching costs” is a strategy.
Reporting and Stakeholder Alignment 📝
The final stage involves communicating findings to stakeholders. Clarity is paramount.
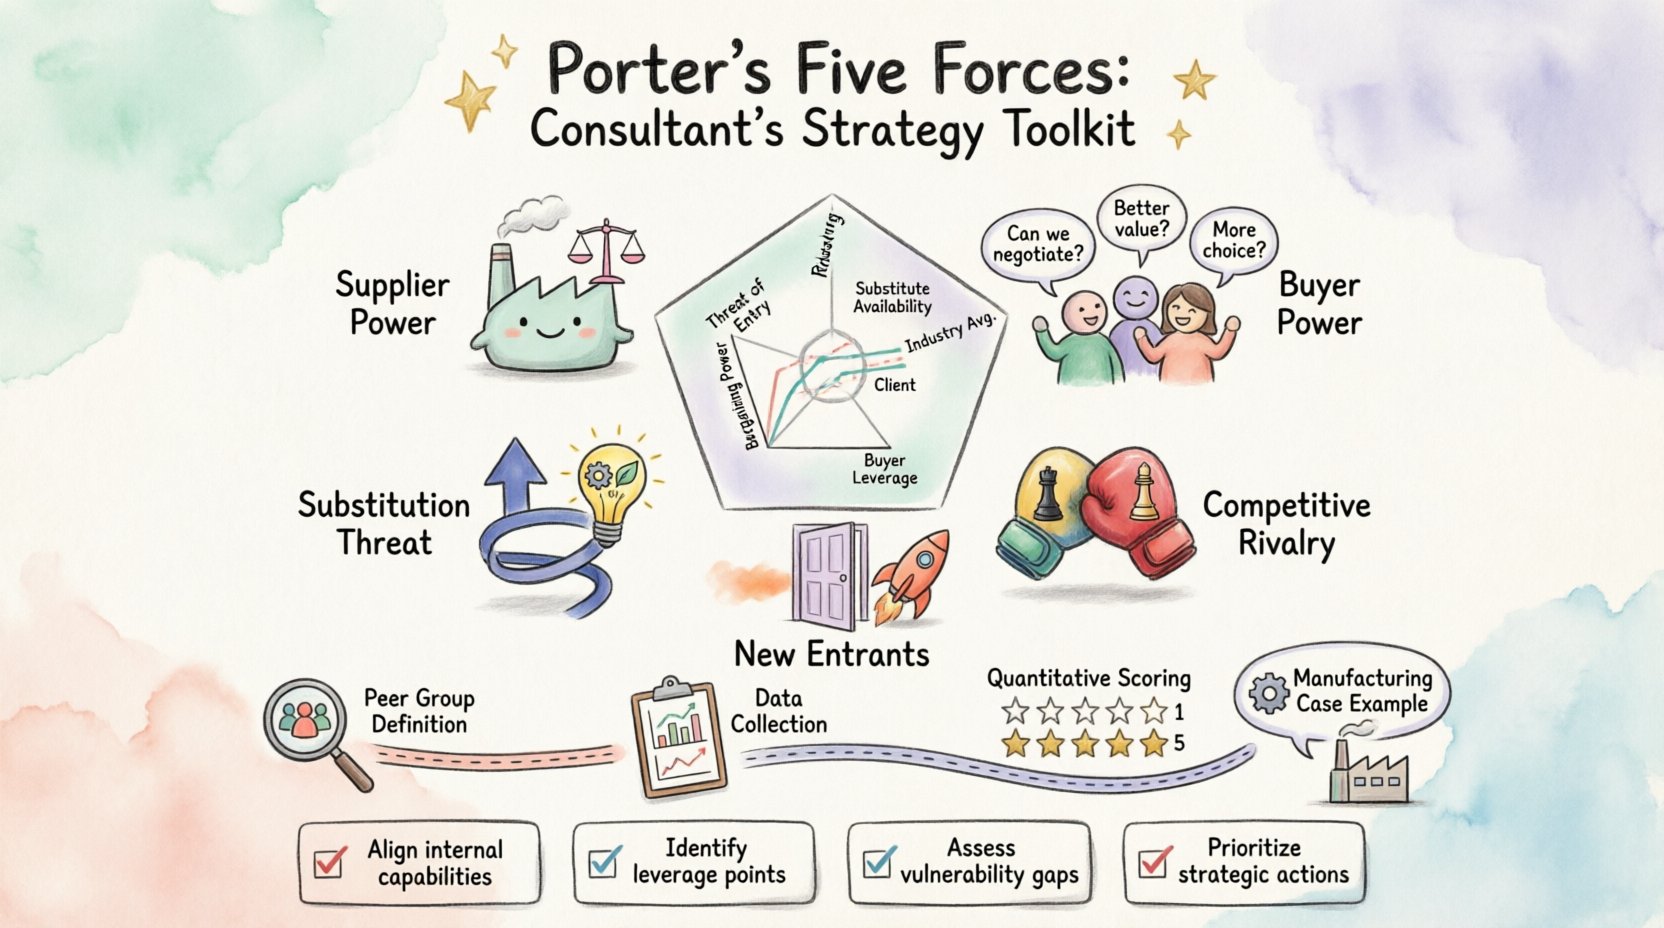
Visualizing the Data
Use spider charts to show the client’s force profile against the industry average. Heat maps can highlight areas of high risk.
Key Takeaways
- Focus on the High-Impact Forces: Do not dilute the message. Identify the 1-2 forces driving the most pressure.
- Connect to Financials: Show how the force analysis impacts EBITDA, margins, and cash flow.
- Provide Options: Offer multiple strategic paths with associated risks and rewards.
Case Scenario: Manufacturing Industry 🏭
Consider a mid-sized manufacturing client facing margin compression. A Five Forces benchmarking reveals the following:
- Suppliers: High power due to raw material scarcity.
- Buyers: Moderate power; buyers are price-sensitive.
- Rivalry: High; many competitors fighting for volume.
- Substitution: Low; no direct alternatives.
- Entrants: Moderate; high capital requirements.
Strategic Recommendation: The client should focus on vertical integration to mitigate supplier power. Simultaneously, they should invest in automation to lower costs and defend against price wars. Diversification into adjacent markets can reduce reliance on the saturated core segment.
Conclusion on Strategic Value ✅
Porter’s Five Forces provides a disciplined approach to understanding industry structure. When integrated with competitive benchmarking, it becomes a powerful tool for consultants. It moves the conversation from “what are we doing?” to “why are we doing it?” and “what is the environment allowing us to do?”
Success requires rigorous data collection, objective scoring, and the courage to recommend difficult structural changes. By mastering this toolkit, consultants can deliver strategies that withstand market volatility and drive sustainable growth.
Final Checklist for Implementation
- ☐ Define industry scope clearly
- ☐ Gather data on all five forces
- ☐ Score forces against industry peers
- ☐ Identify top three strategic threats
- ☐ Develop specific action plans for each threat
- ☐ Validate assumptions with stakeholders
- ☐ Monitor forces for changes over time