


Strategic management courses often challenge students to analyze complex business environments and formulate actionable plans. Among the various frameworks available, Michael Porter’s Five Forces model remains a cornerstone for understanding competitive dynamics. This guide explores how to effectively integrate this framework into academic assignments, ensuring your analysis is robust, evidence-based, and insightful. Whether you are writing a case study or preparing a group project, applying this model correctly can significantly elevate the quality of your work.
Why Use Porter’s Five Forces in Academic Projects? 🧩
Professors and evaluators look for more than just definitions. They want to see application. The Five Forces model provides a structured way to dissect an industry. It moves beyond surface-level observations to examine the underlying economic structures that drive profitability. Using this framework in your coursework demonstrates:
- Systematic Thinking: You are not guessing; you are analyzing specific drivers of competition.
- Contextual Understanding: You recognize that a business operates within an ecosystem of rivals, suppliers, and customers.
- Strategic Relevance: You link industry conditions directly to potential corporate strategies.
This approach ensures your project moves from descriptive to analytical. It shifts the focus from what a company does to why the industry is structured the way it is.
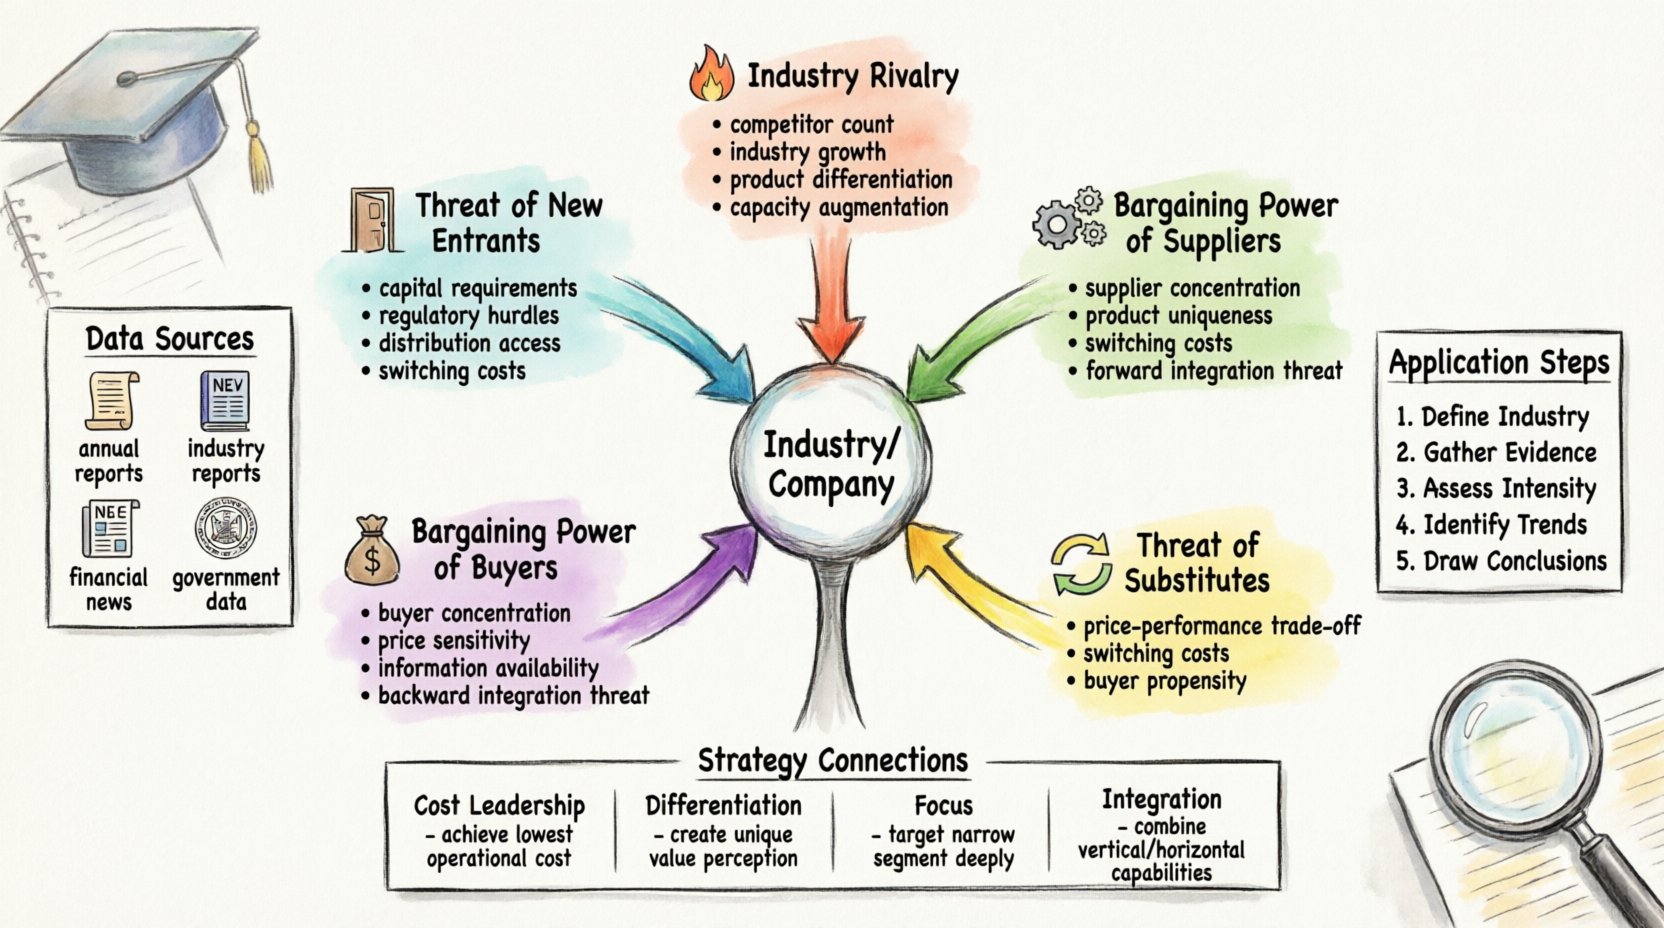
Understanding the Five Forces Breakdown 🔍
To apply this model successfully, you must understand the components deeply. Each force represents a threat or opportunity that affects the collective profit potential of an industry. Below is a detailed examination of each force.
1. Threat of New Entrants 🚪
This force examines how easy or difficult it is for new competitors to enter the market. High barriers to entry protect existing firms, while low barriers invite disruption.
- Capital Requirements: Does the industry require massive investment to start? (e.g., Automobile manufacturing vs. Consulting).
- Regulatory Hurdles: Are there licenses, patents, or government restrictions involved?
- Access to Distribution: Can new players easily get their products to customers?
- Switching Costs: Do customers face high costs to switch to a new provider?
2. Bargaining Power of Suppliers ⚙️
Suppliers can drive up prices or reduce quality, squeezing industry profits. This force analyzes the leverage suppliers hold over the companies in the industry.
- Supplier Concentration: Are there few suppliers or many?
- Uniqueness of Product: Are the inputs specialized or commoditized?
- Switching Costs: Is it expensive for the industry to change suppliers?
- Threat of Forward Integration: Can suppliers easily become competitors?
3. Bargaining Power of Buyers 💰
Buyers exert pressure by demanding lower prices or higher quality. Their power depends on their ability to shop around and the impact they have on the industry.
- Concentration of Buyers: Are there a few large buyers or many small ones?
- Price Sensitivity: How much does the product cost relative to the buyer’s income?
- Availability of Information: Do buyers know the market prices clearly?
- Threat of Backward Integration: Can buyers produce the product themselves?
4. Threat of Substitutes 🔄
Substitutes are products from outside the industry that satisfy the same need. They place a ceiling on prices.
- Price-Performance Trade-off: Is the substitute cheaper or better?
- Switching Costs: How easy is it for customers to change to the substitute?
- Buyer Propensity to Substitute: Are customers naturally looking for alternatives?
5. Industry Rivalry 🔥
This is the intensity of competition among existing firms. High rivalry leads to price wars, advertising battles, and innovation races.
- Number of Competitors: Is the market fragmented or dominated by a few?
- Industry Growth: Is the market growing slowly (fight for share) or quickly (expand pie)?
- Product Differentiation: Are products identical or unique?
- Capacity Augmentation: Does adding capacity require huge investments?
Data Collection Strategies for Students 📚
Academic rigor requires evidence. You cannot simply state that a force is high; you must prove it. Reliable data sources are critical for a high-grade project.
- Company Annual Reports: 10-K filings provide insights into supplier concentration, customer concentration, and competitive risks.
- Industry Reports: Market research firms publish data on market size, growth rates, and key players.
- Financial News: Articles from reputable business publications often discuss strategic shifts and competitive threats.
- Government Data: Census data and regulatory filings offer insights into market entry barriers and labor markets.
When gathering data, always cite your sources. Cross-reference information to ensure accuracy. Avoid relying on a single blog post or unverified website for critical analysis points.
Applying the Analysis: Step-by-Step Guide 📝
Once you have the data, you need to structure your findings logically. Follow this workflow to ensure a coherent argument.
- Define the Industry: Be specific. Is it “Airlines” or “Low-Cost Carriers in Europe”? Precision matters.
- Gather Evidence: Collect data points for each of the five forces.
- Assess Intensity: Rate each force as High, Medium, or Low based on the evidence.
- Identify Trends: Is the industry changing? Is one force becoming stronger over time?
- Draw Conclusions: What does the overall structure say about profitability?
Visualizing the Results 📊
Visual aids help evaluators grasp your analysis quickly. A diagram showing the forces pointing toward an industry center is standard, but tables add analytical depth.
Consider using a matrix to compare forces against specific industry examples. The following table illustrates how to structure your findings for clarity.
| Force | Intensity (High/Med/Low) | Key Evidence | Impact on Profitability |
|---|---|---|---|
| New Entrants | Low | High capital requirements | Protects margins |
| Supplier Power | High | Single source for key component | Reduces margins |
| Buyer Power | Medium | Multiple suppliers available | Moderate pressure |
| Substitutes | Medium | Rise of digital alternatives | Limits pricing power |
| Rivalry | High | Price wars and capacity expansion | Significant margin erosion |
Connecting Analysis to Strategy 🚀
Analysis without action is just theory. Your project must bridge the gap between industry structure and corporate strategy. Use the findings to recommend specific strategic moves.
- Cost Leadership: If rivalry is high and suppliers are powerful, focus on efficiency to lower costs below competitors.
- Differentiation: If buyer power is high, create unique features that make switching difficult.
- Focus: If the industry is fragmented, target a specific niche where forces are weaker.
- Integration: If supplier power is threatening, consider acquiring a supplier or forming long-term contracts.
Explain why the strategy fits the industry forces. For example, if the threat of new entrants is low due to patents, a strategy might focus on leveraging that monopoly power for R&D investment.
Common Pitfalls in Student Projects ⚠️
Even well-prepared students can lose marks due to avoidable errors. Be mindful of these common mistakes.
- Mixing Up Forces: Confusing “Substitutes” with “New Entrants” is common. Remember, substitutes come from outside the industry definition.
- Generalizations: Avoid stating “Technology is changing everything.” Specify how technology changes the specific force.
- Ignoring Trends: The model is static, but industries are dynamic. Discuss how forces might evolve in the next 3-5 years.
- Weak Evidence: Do not rely on assumptions. Use financial data or market statistics to back up claims.
- Forced Conclusions: Do not force the industry to fit the framework. If a force is irrelevant, state that and explain why.
Grading Criteria: What Professors Look For 📝
Understanding how your work will be assessed helps you tailor your content. Most strategic management rubrics prioritize the following:
- Clarity of Argument: Is the logic easy to follow?
- Depth of Research: Are sources credible and recent?
- Application of Theory: Is the framework applied correctly, not just defined?
- Strategic Insight: Do the recommendations make sense given the analysis?
- Professional Presentation: Are tables and charts clear and well-labeled?
Final Considerations ✅
Integrating Porter’s Five Forces into your coursework requires discipline and critical thinking. It is not enough to list the forces; you must interrogate the industry using them. By gathering solid data, visualizing the results clearly, and linking findings to concrete strategic actions, you create a project that stands out.
Remember, the goal is to demonstrate your ability to think like a strategist. Treat the framework as a tool for discovery, not a checklist to complete. As you work through your assignment, keep asking why behind every fact. This curiosity will lead to deeper insights and a more compelling final submission.
With careful preparation and attention to detail, your analysis of the competitive landscape will serve as a strong foundation for your strategic management studies. Use this guide to navigate the complexities of industry analysis and produce work that reflects professional standards.