


Understanding the structural dynamics of an industry is fundamental to crafting a resilient business strategy. One of the most enduring frameworks for this purpose is the Porter’s Five Forces Analysis. Developed by Michael Porter in 1979, this model helps organizations determine the intensity of competition and the profitability of an industry. By examining five specific forces, businesses can identify where power lies in a business situation.
This guide provides a comprehensive, practical approach to conducting this analysis without relying on proprietary software. It focuses on logical reasoning, data gathering, and strategic interpretation to build a clear picture of your competitive landscape.
📋 Why Conduct a Five Forces Analysis?
Before diving into the mechanics, it is important to understand the objective. This framework does not analyze your specific company’s internal strengths or weaknesses directly. Instead, it looks outward at the market environment. The goal is to assess:
- Profitability Potential: Is the industry capable of sustaining healthy margins?
- Competitive Intensity: How fierce is the battle for market share?
- Barriers to Entry: How easy is it for new players to disrupt the status quo?
- Supply Chain Leverage: Do suppliers or customers hold the cards?
By answering these questions, you can make informed decisions about where to allocate resources, how to price products, and whether to enter or exit a specific market segment.
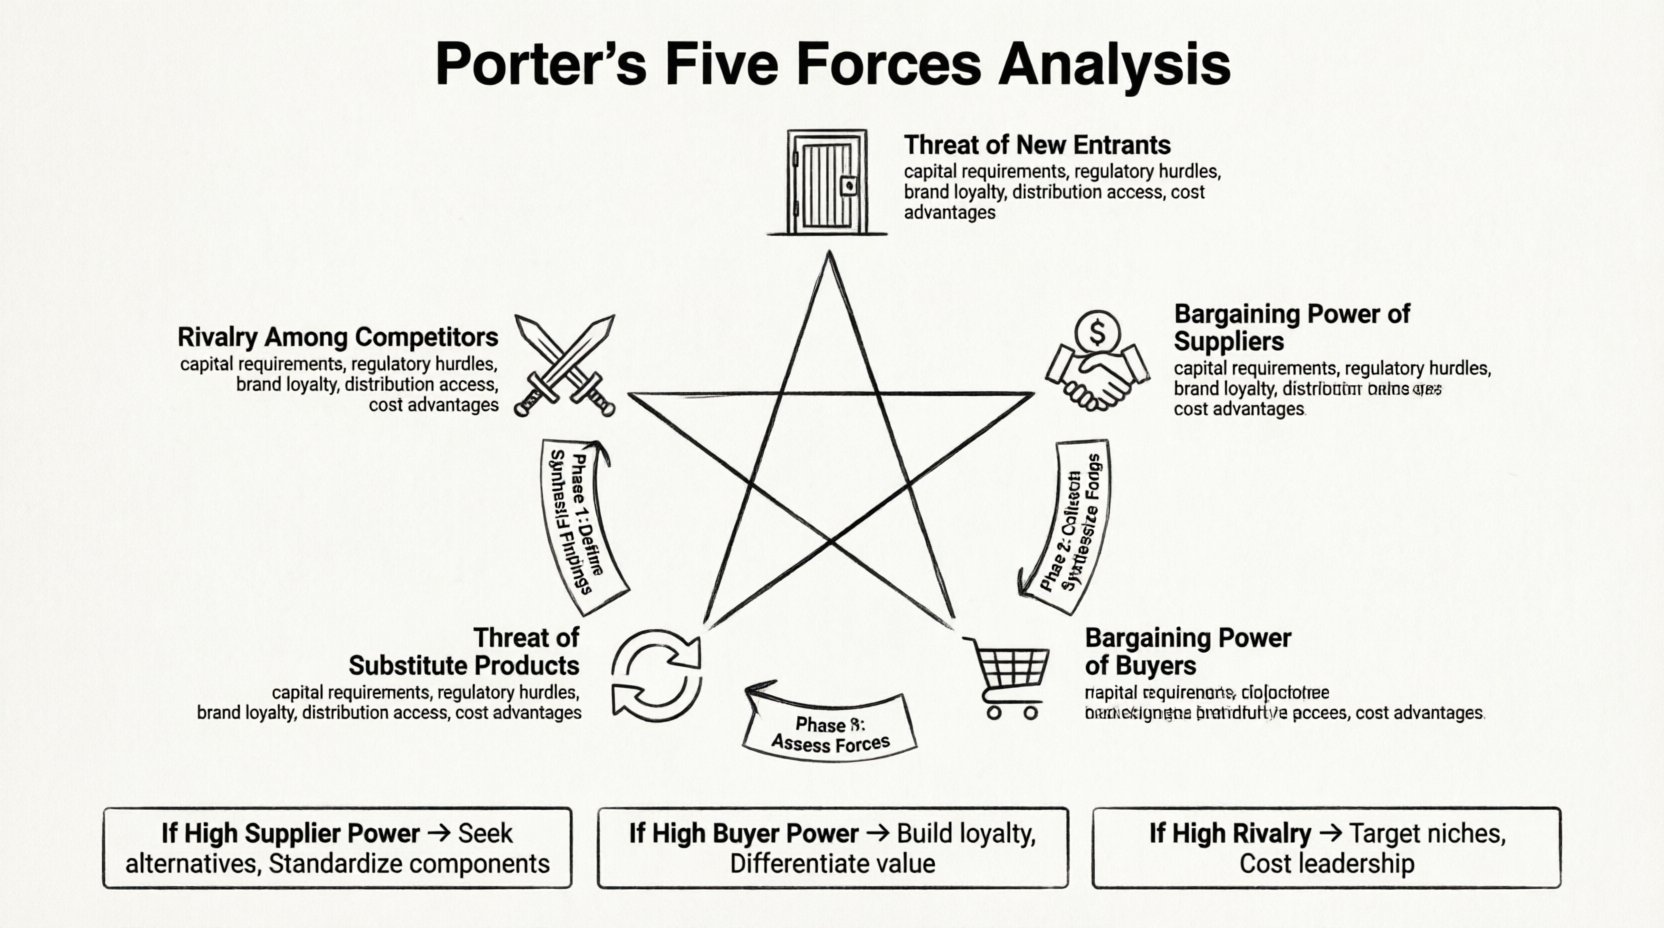
🔍 The Five Forces Explained
The model consists of five distinct forces. Each force represents a different type of threat or pressure that affects the industry’s ability to generate profit. Below is a detailed breakdown of each component.
1️⃣ Threat of New Entrants 🚪
This force measures how easy or difficult it is for competitors to enter the market. If new competitors can enter easily, existing players must constantly defend their market share, which can drive down prices and profitability. Conversely, high barriers to entry protect current incumbents.
Key Factors to Consider:
- Capital Requirements: How much money is needed to start a competing business? High costs deter entry.
- Regulatory Hurdles: Are there licenses, patents, or legal restrictions that block new players?
- Brand Loyalty: Do customers stick to established brands, or are they willing to try new options?
- Access to Distribution Channels: Can a new company get their product into stores or onto platforms easily?
- Cost Advantages: Do existing players have proprietary technology or experience-based cost benefits?
If the threat is high, your strategy should focus on building barriers, such as exclusive partnerships or strong intellectual property.
2️⃣ Bargaining Power of Suppliers 💰
Suppliers can drive up prices or reduce quality, impacting your profitability. The power of suppliers increases when they are fewer in number, when they offer unique products, or when switching costs are high for your business.
Key Factors to Consider:
- Concentration: Are there only a few suppliers for a critical input?
- Uniqueness: Is the input differentiated or commoditized?
- Switching Costs: How much does it cost to change suppliers?
- Forward Integration: Can the supplier enter your business and compete directly?
- Importance of Volume: Does your business represent a significant portion of their revenue?
When supplier power is high, consider negotiating long-term contracts or seeking alternative sources to mitigate risk.
3️⃣ Bargaining Power of Buyers 💳
Buyers exert power when they can demand lower prices or higher quality. This force is strong when buyers are concentrated, purchase large volumes, or have access to many competing products.
Key Factors to Consider:
- Concentration of Buyers: Are there many small buyers or a few large ones?
- Product Differentiation: Is your product unique, or is it a commodity?
- Price Sensitivity: How much does price affect the buyer’s decision?
- Threat of Backward Integration: Can the buyer manufacture the product themselves?
- Availability of Information: Do buyers know the prices and quality of competitors easily?
If buyer power is high, focus on increasing switching costs for the customer or enhancing product value so price becomes less critical.
4️⃣ Threat of Substitute Products 🔄
Substitutes are products or services from outside your industry that fulfill the same need. For example, video conferencing is a substitute for business travel. The threat is high when substitutes offer a better price-performance trade-off.
Key Factors to Consider:
- Price-Performance Ratio: Are substitutes cheaper or better than your offering?
- Switching Costs: How easy is it for customers to switch to the substitute?
- Trends: Is the substitute gaining popularity or falling out of favor?
- Perceived Value: Does the customer view the substitute as a viable alternative?
Monitoring this force helps you understand if your core product is at risk of obsolescence due to technological shifts.
5️⃣ Rivalry Among Existing Competitors ⚔️
This is often the most visible force. It involves the intensity of competition between current players. High rivalry leads to price wars, advertising battles, and innovation races, which can erode profits.
Key Factors to Consider:
- Number of Competitors: Are there many players or an oligopoly?
- Industry Growth: Is the market expanding, or is it stagnant?
- Fixed Costs: Are there high fixed costs that pressure companies to fill capacity?
- Product Homogeneity: Are products identical, forcing competition on price?
- Exit Barriers: Is it difficult to leave the industry if it becomes unprofitable?
📊 Comparing Force Intensity
To make this analysis practical, it helps to categorize the intensity of each force. The following table outlines the indicators for High, Medium, and Low intensity.
| Intensity Level | High Intensity Indicators | Low Intensity Indicators |
|---|---|---|
| High | Many competitors, low switching costs, commoditized products, rapid price wars. | Few competitors, high switching costs, differentiated products. |
| Medium | Stable competition, moderate differentiation, some price sensitivity. | Emerging market, unclear rules of engagement. |
| Low | Monopoly or near-monopoly, high barriers to entry, strong brand loyalty. | Fragmented market with no clear leader. |
🛠️ Step-by-Step Process to Conduct the Analysis
Now that the theory is clear, here is the practical workflow to execute the analysis from scratch. This process requires time, research, and critical thinking.
Phase 1: Preparation and Scope Definition
Before gathering data, define the boundaries of your analysis.
- Define the Industry: Be specific. Are you analyzing the “Smartphone Market” or the “Consumer Electronics Industry”? Narrower scopes yield more accurate results.
- Identify the Geography: Market dynamics differ by region. A local market analysis differs from a global one.
- Set the Timeframe: Industry conditions change. Decide if you are analyzing the current state or a projection for the next 3-5 years.
Phase 2: Data Collection
You need reliable information to assess the forces. Since we are not using specialized software, rely on the following sources:
- Public Financial Reports: Review 10-K filings and annual reports of competitors to understand their margins and cost structures.
- Industry Reports: Look for trade publications, market research summaries, and government statistics.
- Customer Feedback: Analyze reviews, surveys, and direct conversations to understand buyer satisfaction and switching behavior.
- Supplier Interviews: If possible, speak with vendors to understand their pricing power and capacity constraints.
- Competitor Websites: Monitor their product launches, pricing changes, and marketing messages.
Phase 3: Assessing Each Force
For each of the five forces, apply the questions listed in the previous section. Assign a rating (High, Medium, Low) based on the evidence you found. Do not rely on assumptions; back every claim with data or logical deduction.
Example: If you are analyzing the coffee shop industry, consider the bargaining power of suppliers (coffee beans). If most beans come from a specific region with volatile climate conditions, supplier power might be high.
Phase 4: Synthesizing the Findings
Once all forces are assessed, look at the aggregate picture.
- Overall Attractiveness: If most forces are high, the industry is unattractive for profit. If most are low, it is fertile ground for growth.
- Key Drivers: Identify which forces are the most significant threats. Focus your energy there.
- Strategic Gaps: Look for opportunities where the forces are weak that you can exploit.
🧩 Integrating with Other Strategic Tools
The Five Forces Analysis is powerful, but it works best when combined with other frameworks. It focuses on the external environment, while tools like SWOT Analysis can incorporate internal factors.
Combining with SWOT Analysis
- Threats (SWOT): Map the Five Forces directly to the Threats quadrant.
- Opportunities (SWOT): Identify where the Five Forces suggest gaps in the market.
- Weaknesses (SWOT): Determine if internal weaknesses expose the company to the Five Forces.
- Strengths (SWOT): Identify internal capabilities that can neutralize external threats.
🚫 Common Pitfalls to Avoid
Even experienced strategists can make mistakes when applying this model. Be aware of these common errors.
- Ignoring Substitutes: Many companies focus only on direct competitors but miss substitutes that kill industries (e.g., digital cameras vs. film).
- Static Analysis: Markets are dynamic. An analysis done today may be outdated in six months. Update it regularly.
- Overgeneralization: Avoid assuming the whole industry is the same. Segments within an industry can have different force dynamics.
- Lack of Data: Guessing the intensity of forces without evidence leads to flawed strategies.
- Internal Bias: Do not let your desire for a specific outcome influence your assessment of the data.
📈 Interpreting the Results for Strategy
The output of this analysis is not just a report; it is a guide for action. Here is how to translate the findings into strategic moves.
If Supplier Power is High
- Seek alternative suppliers.
- Integrate forward or backward.
- Standardize components to reduce dependency.
If Buyer Power is High
- Develop unique value propositions.
- Create loyalty programs to increase switching costs.
- Diversify your customer base.
If Rivalry is High
- Differentiate your product.
- Target niche segments.
- Focus on cost leadership if possible.
If Barriers to Entry are Low
- Build strong brand equity.
- Secure exclusive distribution deals.
- Patent proprietary technology.
🌍 Real-World Application Example
Consider the electric vehicle (EV) manufacturing sector. How might the forces look?
- Threat of New Entrants: Medium. Capital is high, but tech giants are entering.
- Supplier Power: High. Battery raw materials (lithium, cobalt) are concentrated.
- Buyer Power: Increasing. Consumers have many choices, and government incentives are shifting.
- Substitutes: High. Public transport, traditional ICE vehicles, and ride-sharing are alternatives.
- Rivalry: High. Traditional automakers and startups are fighting for market share.
This assessment suggests that a new EV company must secure supply chains for batteries and differentiate strongly to survive.
🔧 Final Steps for Implementation
To ensure this analysis remains useful, treat it as a living document.
- Document Assumptions: Write down why you rated each force as you did. This creates a baseline for future comparison.
- Assign Owners: Designate team members to monitor specific forces (e.g., a supply chain manager monitors supplier power).
- Schedule Reviews: Set a quarterly or bi-annual review date to update the findings.
- Share Widely: Ensure the leadership team and department heads understand the competitive landscape.
By following this structured approach, you move beyond guesswork. You build a strategic foundation based on the actual economic forces shaping your industry. This clarity allows for better resource allocation, risk management, and long-term planning.
Remember that the goal is not just to understand the competition, but to understand the *structure* of the competition. When you grasp the underlying mechanics of the market, you can position your organization to thrive regardless of the intensity of the rivalry.