


Understanding the competitive landscape is essential for any strategic decision-making process. Whether you are launching a new venture or assessing an existing market position, knowing where the profit pools lie is critical. This guide details how to apply Porter’s Five Forces framework to evaluate industry attractiveness and profit potential effectively.
Developed by Michael E. Porter in 1979, this analytical tool provides a structured approach to understanding the competitive intensity and attractiveness of a market. By examining five specific forces, organizations can determine the underlying economics of an industry and identify opportunities for sustainable advantage. This comprehensive analysis moves beyond surface-level competition to uncover the structural drivers of profitability.
Why Industry Structure Matters 🏗️
Profitability is not solely a function of a company’s internal efficiency. It is heavily influenced by the external environment. A business operating in a highly competitive, fragmented industry with low barriers to entry often faces margin pressure. Conversely, an industry with high barriers and limited substitutes can support robust returns.
The Five Forces framework shifts the focus from the company itself to the industry in which it operates. It helps answer fundamental questions:
- How much power do suppliers have to drive up costs?
- Can buyers easily switch to competitors?
- Are new competitors likely to enter and dilute margins?
- Are there alternative solutions that limit pricing power?
- How intense is the rivalry among current players?
Answering these questions allows strategists to gauge the long-term profit potential of a sector. It reveals whether the industry structure favors the industry participants or the customers and suppliers.
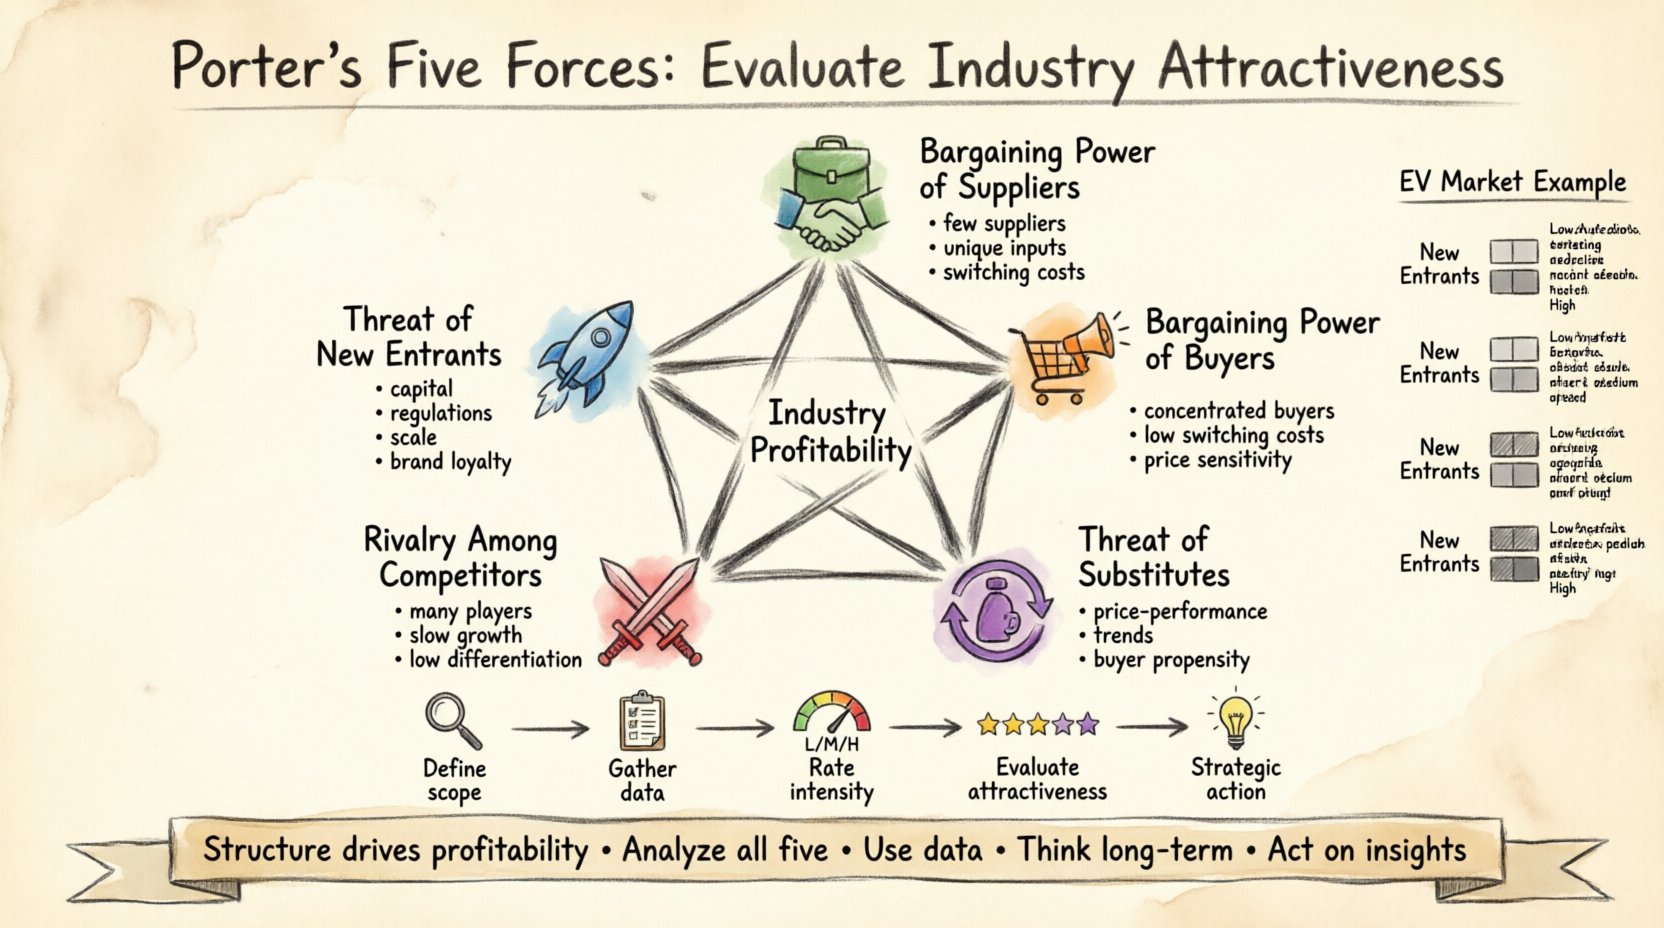
The Five Forces Deep Dive 🔍
To evaluate industry attractiveness, each of the five forces must be analyzed individually. The strength of each force dictates the overall profitability of the industry. Below is a detailed breakdown of each component.
1. Threat of New Entrants 🚀
This force assesses how easy it is for new competitors to enter the market. High threat implies low profitability, as new entrants bring additional capacity, aggressive pricing, and competition for market share. Low threat suggests a protected market with stable returns.
Key Indicators to Analyze:
- Capital Requirements: High capital needs (e.g., manufacturing plants, R&D) deter entry.
- Regulatory Barriers: Licenses, patents, and government policies can restrict access.
- Access to Distribution Channels: If established players control key retail or logistics networks, new players struggle.
- Switching Costs: High costs for customers to switch to a new provider protect incumbents.
- Economies of Scale: If incumbents produce at a lower unit cost due to volume, new entrants face a cost disadvantage.
- Brand Loyalty: Strong established brands make it difficult for newcomers to gain traction.
- Government Policy: Trade restrictions or subsidies can alter the playing field.
2. Bargaining Power of Suppliers 💼
Suppliers can drive up prices or reduce quality, thereby squeezing industry profits. This force is strong when suppliers have leverage over the buyers. It is weak when buyers can easily find alternatives.
Key Indicators to Analyze:
- Number of Suppliers: Fewer suppliers generally mean higher power.
- Uniqueness of Product: If inputs are differentiated or specialized, switching is costly.
- Switching Costs: High costs to change suppliers increase supplier power.
- Threat of Forward Integration: If suppliers can easily enter the industry (e.g., a component maker opening a retail store), buyers face a threat.
- Importance of Volume: If the supplier sells a small volume to the industry, they are less powerful.
- Availability of Substitutes: If alternative inputs exist, supplier power diminishes.
3. Bargaining Power of Buyers 🛒
Buyers exert pressure on prices and quality. High buyer power leads to lower margins for the industry. This occurs when buyers are concentrated or can easily switch.
Key Indicators to Analyze:
- Concentration of Buyers: Few large buyers hold significant leverage.
- Volume Purchased: Large purchases relative to the supplier’s sales increase buyer power.
- Standardized Products: If products are undifferentiated, buyers choose based on price.
- Switching Costs: Low costs for buyers to switch to competitors increase their power.
- Threat of Backward Integration: If buyers can produce the product themselves, they have leverage.
- Price Sensitivity: If the product is a significant portion of the buyer’s cost, they negotiate harder.
- Availability of Information: Buyers with full market information can negotiate better terms.
4. Threat of Substitute Products 🔄
Substitutes are products from outside the industry that perform the same function. They place a ceiling on prices. If substitutes are cheap or better, the industry cannot raise prices without losing customers.
Key Indicators to Analyze:
- Relative Price-Performance: If substitutes offer better value, they threaten incumbents.
- Switching Costs: Low costs for customers to adopt a substitute increase the threat.
- Buyer Propensity to Substitute: Some customers are naturally open to trying alternatives.
- Perceived Quality: If substitutes are perceived as high quality, the threat is higher.
- Trends: Technological shifts often introduce new substitutes (e.g., digital streaming vs. physical media).
5. Rivalry Among Existing Competitors ⚔️
This is the most visible force. It refers to the intensity of competition among current players. High rivalry leads to price wars, advertising battles, and innovation races, all of which reduce profitability.
Key Indicators to Analyze:
- Number of Competitors: Many equally balanced competitors increase rivalry.
- Industry Growth Rate: Slow growth forces companies to fight for market share.
- Fixed Costs: High fixed costs create pressure to utilize capacity, often leading to price cuts.
- Differentiation: Low differentiation encourages price competition.
- Capacity Increment: Large, discrete capacity additions can disrupt supply and demand balance.
- Exit Barriers: High costs to leave the industry (e.g., specialized assets) trap players, sustaining rivalry.
- Strategic Stakes: If the market is critical to a company’s survival, they fight harder.
Step-by-Step Application Guide 📝
Applying this framework requires a systematic approach. Follow these steps to conduct a robust analysis for any industry.
Step 1: Define the Industry Scope 🔎
Before analyzing, clearly define what constitutes the industry. This includes the specific product categories, geographic regions, and customer segments. A broad definition might mask high rivalry in a specific niche, while a narrow definition might miss substitute threats.
- Specify the product boundaries.
- Identify the geographic market.
- Define the target customer segment.
Step 2: Gather Data on Each Force 📊
Collect qualitative and quantitative data for each of the five forces. This involves market research, financial analysis, and competitive intelligence.
- Review financial reports of key players.
- Conduct interviews with industry experts or suppliers.
- Analyze regulatory filings.
- Survey customer satisfaction and switching behavior.
Step 3: Assess the Intensity of Each Force 🎯
Rate each force as Low, Medium, or High. Use evidence gathered in the previous step to support the rating. Avoid intuition; rely on data.
- Low: The force does not significantly impact profitability.
- Medium: The force has a moderate impact on margins.
- High: The force exerts significant pressure on profitability.
Step 4: Evaluate Industry Attractiveness 📉
Combine the ratings to determine the overall attractiveness. An industry with three or more “High” forces is generally unattractive. One with predominantly “Low” forces is attractive.
| Force | Intensity (L/M/H) | Impact on Profitability |
|---|---|---|
| Threat of New Entrants | Medium | Moderate pressure on margins |
| Bargaining Power of Suppliers | High | Significant cost pressure |
| Bargaining Power of Buyers | Low | Stable pricing power |
| Threat of Substitutes | Medium | Some pricing ceiling |
| Rivalry Among Competitors | High | Aggressive price competition |
Step 5: Identify Strategic Implications 🧠
Use the analysis to inform strategy. If the industry is unattractive, consider diversification or niche focus. If attractive, look for ways to capture value before competitors do.
- Develop barriers to entry.
- Build supplier relationships.
- Enhance product differentiation.
- Monitor substitute technologies.
Real-World Context: The Electric Vehicle Market ⚡
Consider the Electric Vehicle (EV) industry. Applying the Five Forces provides insight into the current state of profitability.
- Threat of New Entrants: Medium/High. While capital requirements are high, tech companies and startups are entering the space. However, regulatory hurdles and manufacturing scale remain barriers.
- Bargaining Power of Suppliers: High. Battery manufacturers and raw material suppliers (lithium, cobalt) have significant leverage due to supply constraints.
- Bargaining Power of Buyers: Medium. While choice is increasing, brand loyalty and charging infrastructure lock-in affect switching costs.
- Threat of Substitutes: Medium. Internal combustion engines, hybrids, and public transport exist as alternatives.
- Rivalry Among Competitors: High. Established automakers and new tech entrants compete aggressively on price and features.
This analysis suggests that while demand is growing, profitability is currently under pressure from supplier power and intense rivalry. Long-term value creation depends on securing supply chains and achieving scale.
Common Pitfalls and Limitations ⚠️
While powerful, the framework has limitations. Analysts must be aware of potential blind spots.
Static Analysis
The framework is often viewed as a snapshot in time. Industries evolve rapidly, particularly in technology. A static analysis might miss dynamic shifts in competitive dynamics.
Industry Boundaries
Defining the industry can be subjective. In modern ecosystems, companies often operate across multiple sectors. A narrow definition might miss cross-industry substitution threats.
Complementary Products
The original model focuses on substitutes, not complements. In some industries (e.g., software and hardware), the presence of complementary goods drives value more than substitutes.
External Factors
The model does not explicitly account for macroeconomic factors, such as interest rates, inflation, or geopolitical shifts, which can override industry structure.
Integrating with Other Strategic Tools 🔗
To get a complete picture, combine the Five Forces with other analytical frameworks.
- SWOT Analysis: Use Five Forces for the “Opportunities” and “Threats” sections of a SWOT analysis.
- PESTLE Analysis: Combine with Political, Economic, Social, Technological, Legal, and Environmental factors for a broader macro view.
- Value Chain Analysis: Once industry attractiveness is determined, use Value Chain analysis to identify where within the company value can be created or costs reduced.
- Blue Ocean Strategy: If the industry is highly unattractive, look for ways to create new market space rather than competing within existing boundaries.
Building a Sustainable Competitive Advantage 🏆
The goal of applying this framework is not just to understand the industry, but to position the organization within it. Once the forces are understood, strategy can be designed to mitigate the negative forces and exploit the positive ones.
Strategic Responses to High Supplier Power:
- Develop multiple supplier sources.
- Vertical integration to control supply.
- Design products to use generic inputs.
Strategic Responses to High Buyer Power:
- Differentiate the product to reduce price sensitivity.
- Increase switching costs through loyalty programs or proprietary technology.
- Focus on niche segments with lower buyer concentration.
Strategic Responses to High Rivalry:
- Focus on cost leadership to withstand price wars.
- Pursue differentiation to escape direct competition.
- Consolidate the market through mergers and acquisitions.
Monitoring and Continuous Review 🔄
Industry structures are not static. Forces shift over time due to technology, regulation, and consumer behavior. A one-time analysis is insufficient.
Establish a routine to review the Five Forces.
- Conduct annual reviews of the competitive landscape.
- Monitor early warning signals for new entrants or substitutes.
- Track changes in supplier and buyer consolidation.
- Update strategic plans based on new data.
By maintaining a dynamic view of the industry, organizations can adapt their strategies proactively rather than reactively.
Summary of Key Takeaways 📌
Evaluating industry attractiveness requires a deep dive into structural factors. Porter’s Five Forces provide a robust methodology for this task.
- Focus on Structure: Profitability is driven by industry structure, not just company performance.
- Analyze All Five: Do not overlook any single force; the weakest link determines the ceiling for profits.
- Use Data: Base ratings on evidence, not assumptions.
- Think Long Term: Consider how forces might evolve over the next 5 to 10 years.
- Act on Insights: Use the analysis to guide strategic decisions regarding investment, pricing, and positioning.
Applying this framework equips decision-makers with the clarity needed to navigate complex markets. It transforms vague competitive concerns into actionable intelligence, supporting sustainable growth and resilience in a changing economic environment.