Effective system design begins with understanding the movement of data within an organization. When teams attempt to build complex software without a clear map, they often encounter misalignment between business needs and technical execution. Modeling information systems provides a structured approach to visualize these interactions. At the heart of this practice lies the Data Flow Diagram, a powerful tool for documenting how information is processed, stored, and transmitted.
This article explores the principles of modeling information systems through the lens of Data Flow Diagrams (DFDs). We will examine the components, levels of abstraction, and analytical techniques required to create robust system models. By focusing on the logic of data movement rather than the physical implementation, analysts can ensure clarity and accuracy before any code is written.
Understanding the Purpose of System Modeling 🧩
Before diving into specific symbols, it is essential to grasp why we model systems. An information system is more than just a database or a user interface; it is a network of processes that transform inputs into useful outputs. Modeling allows stakeholders to see the big picture without getting lost in technical details.
- Communication: Visual diagrams bridge the gap between technical teams and business users. Everyone can see the same flow of information.
- Verification: Models help verify that all business requirements are accounted for before development begins.
- Documentation: They serve as a lasting record of how the system operates, useful for future maintenance and training.
- Analysis: Diagrams reveal bottlenecks, redundant processes, and potential security gaps in data handling.
When you model an information system, you are essentially creating a blueprint. Just as an architect does not build a house without a plan, a system architect should not write logic without a map. This approach reduces rework and ensures the final product aligns with organizational goals.
The Core Components of a Data Flow Diagram 🏗️
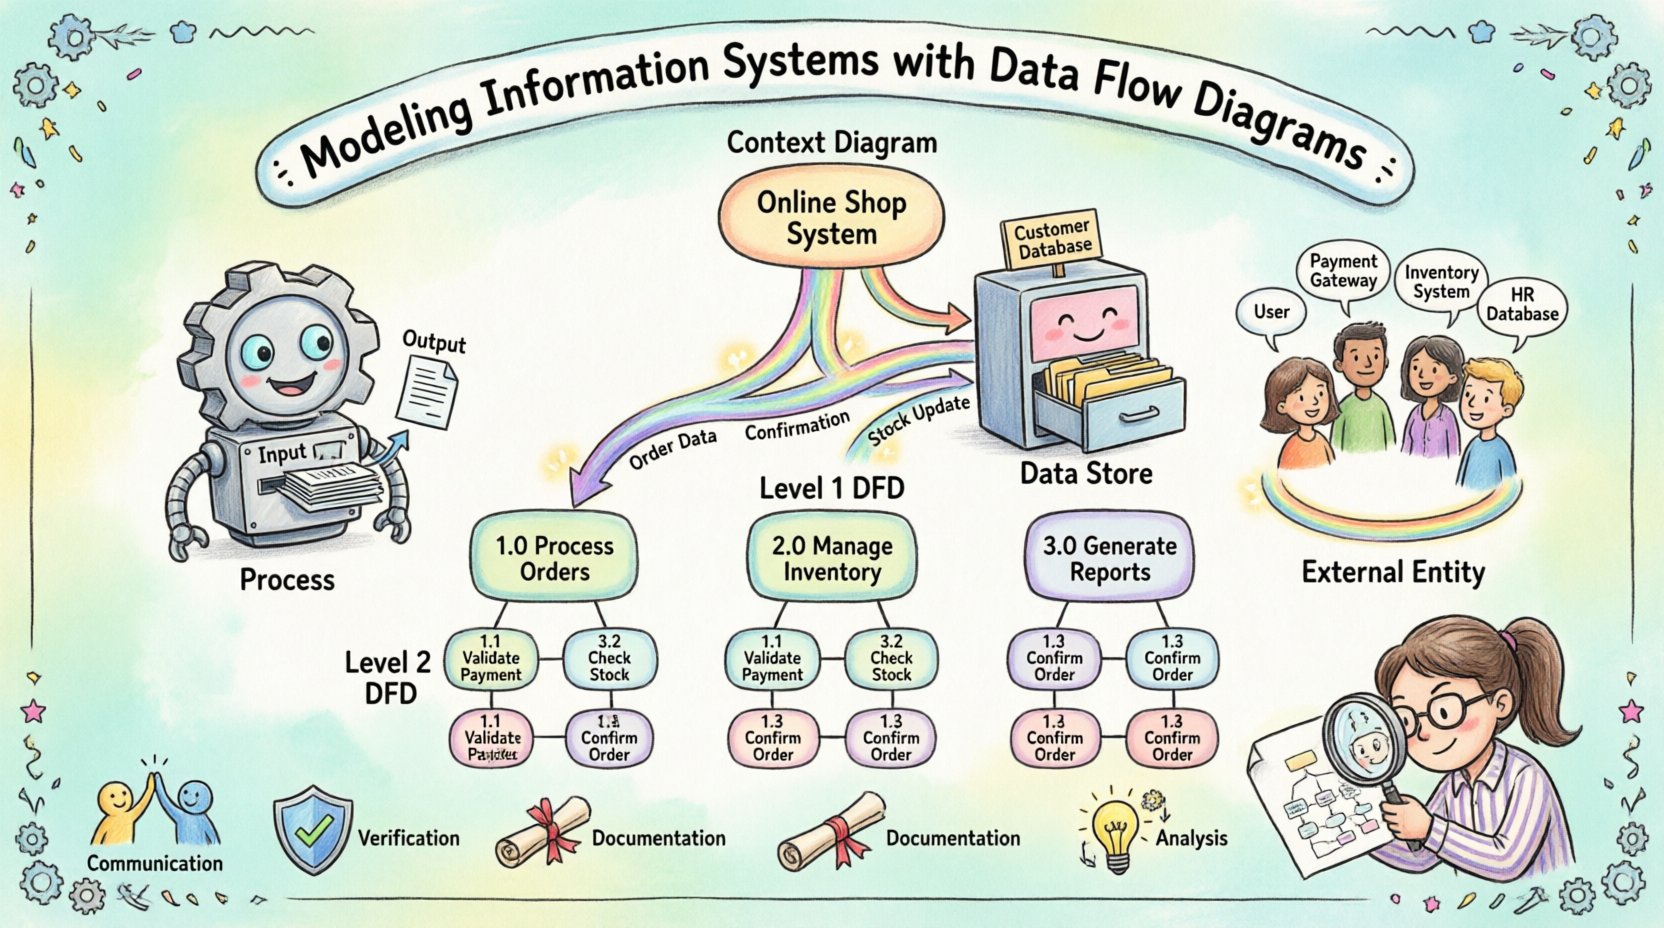
A Data Flow Diagram relies on four primary elements to represent the system. Each element has a specific role and visual representation. Understanding these building blocks is the first step toward creating a valid model.
1. Processes ⚙️
Processes represent actions that transform data. They are the engines of the system. A process takes input data, performs some operation, and produces output data. In a diagram, a process is often depicted as a circle or a rounded rectangle. It must have a name that describes the action, such as “Calculate Tax” or “Validate Login”.
Every process must have at least one input and one output. A process cannot simply exist without transforming data. If data enters a process but nothing leaves, the model is incomplete. If data leaves without entering, the output is unexplained. This conservation principle ensures logical consistency.
2. Data Stores 🗄️
Data stores represent locations where information is held for later use. These can be physical databases, files, or even physical filing cabinets. In a DFD, a data store is typically shown as an open rectangle or two parallel lines. Unlike processes, data stores do not transform data; they retain it.
It is crucial to distinguish between a process and a data store. A process changes the state of data, while a data store preserves it. Connections between processes and data stores indicate that data is being read from or written to storage. This distinction helps clarify whether information is being actively processed or simply archived.
3. External Entities 👥
External entities are sources or destinations of data outside the system boundary. They interact with the system but are not part of the internal logic. Examples include customers, suppliers, regulatory bodies, or other systems. In diagrams, these are often represented as squares or rectangles.
When modeling, define the scope clearly. What is inside the system and what is outside? An external entity is anything you cannot control or modify directly within the scope of the current model. This helps focus the analysis on the boundaries of responsibility.
4. Data Flows 🔄
Data flows show the movement of information between processes, stores, and entities. They are represented by arrows. Every arrow must have a label describing the data being moved, such as “Order Details” or “Payment Receipt”.
Data flows do not represent control signals or timing. They represent the actual information payload. A flow can split or merge, but it must always carry meaningful data. Arrows should not cross unnecessarily to maintain readability. If a flow connects two processes, it indicates a direct handoff of information.
Levels of Abstraction and Decomposition 🔍
Complex systems cannot be understood in a single view. To manage complexity, analysts use decomposition, breaking the system down into manageable layers. This hierarchical approach allows for different levels of detail depending on the audience and purpose.
Context Diagram (Level 0)
The Context Diagram provides the highest level of abstraction. It shows the entire system as a single process and identifies all external entities interacting with it. This view answers the question: “What is the system?” It defines the boundaries clearly.
In this diagram, you do not see internal processes or data stores. You only see the system boundary and the flow of data in and out. This is often the first diagram created to gain stakeholder agreement on the scope.
Level 1 Diagram
The Level 1 Diagram expands the single process from the Context Diagram into major sub-processes. It reveals the main functional areas of the system. For example, a “Manage Order” process might decompose into “Receive Order”, “Check Inventory”, and “Process Payment”.
This level introduces data stores and shows how data moves between the major functions. It is detailed enough for technical teams to understand the architecture but abstract enough to avoid getting bogged down in specific logic.
Level 2 and Beyond
Further decomposition continues until each process is simple enough to be understood without further breakdown. This is often where specific business rules are documented. At this level, the diagram serves as a direct reference for developers writing code.
Decomposition must be balanced. The inputs and outputs of a parent process must match the inputs and outputs of its child processes. If a process splits into three children, the data entering the parent must still enter the children collectively, and the data leaving the children must leave the parent.
Notation Standards and Consistency 📏
While the concepts of DFDs are universal, the symbols used can vary. Two primary notations exist in the industry. Selecting one and sticking to it is vital for clarity.
| Feature |
Yourdon & DeMarco |
Gane & Sarson |
| Process |
Circle or Rounded Rectangle |
Rounded Rectangle |
| Data Store |
Open Rectangle |
Open Rectangle (with thick line) |
| External Entity |
Rectangle |
Rectangle |
| Data Flow |
Curved or Straight Arrow |
Straight Arrow |
Consistency prevents confusion. If a team switches notations midway through a project, the documentation becomes fragmented. It is best to establish a standard early and document it in a style guide.
Additionally, naming conventions should be consistent. Use verbs for processes (e.g., “Update Record”) and nouns for data flows (e.g., “Record Data”). This grammatical distinction helps readers quickly identify the function of each element.
Analyzing the System for Improvement 🛠️
Creating a diagram is not just about documentation; it is about analysis. Once the model exists, you can interrogate it to find inefficiencies or risks.
Identifying Bottlenecks
Look for processes that receive multiple inputs but produce a single output. These areas often become bottlenecks where work piles up. High traffic flows between two specific points may indicate a need for optimization or parallel processing.
Checking Data Integrity
Review how data is stored and retrieved. Are sensitive data flows encrypted in the model? Are data stores validated before writing? A well-modeled system ensures data quality at every step. If data flows directly into a store without validation, the model reveals a potential risk.
Eliminating Redundancy
Do you see the same process repeated across different parts of the diagram? This suggests redundancy. You might be able to consolidate functions into a single service. Reducing duplication saves resources and simplifies maintenance.
Validating Completeness
Ensure every external entity has a corresponding flow. If a customer exists but no data flows to or from them, the model is incomplete. Similarly, check that every data store has a writer and a reader. An orphaned data store suggests unused storage.
Best Practices for Maintenance and Evolution 🌱
Information systems are not static. They evolve as business needs change. A model that is accurate today may be obsolete tomorrow. Therefore, maintaining the documentation is as important as creating it.
Version Control
Keep track of changes to the diagrams. Version numbers or dates should be visible. This helps teams understand what changed and why. It also allows for rollback if a new design proves problematic.
Stakeholder Review
Regularly review models with business users. They are the best source of truth for whether the system matches their workflow. If a process does not match reality, the model is wrong, regardless of how logical it seems.
Integration with Other Models
DFDs do not exist in isolation. They often link with Entity-Relationship Diagrams (ERDs) for data structure and state transition diagrams for system behavior. Ensuring these models align prevents contradictions between process logic and data structure.
The Role of the Analyst 🧑💼
The success of modeling depends heavily on the analyst. They must act as a translator between business language and technical logic. This requires strong communication skills and a deep understanding of the domain.
An effective analyst asks probing questions. “Where does this data come from?” “What happens if this input is missing?” “Who is responsible for this update?” These questions uncover hidden requirements that stakeholders might overlook.
Patience is also key. Modeling is iterative. Initial diagrams will likely be wrong or incomplete. The goal is to refine them through feedback. Do not fear discarding a diagram if it does not work; use the lessons learned to build a better one.
Conclusion and Final Thoughts 🚀
Modeling information systems using Data Flow Diagrams is a fundamental skill for anyone involved in system design. It provides a clear, visual language for discussing complex processes. By focusing on data movement rather than implementation details, teams can ensure alignment and reduce errors.
The journey from a simple context diagram to a detailed level 2 model requires discipline and attention to detail. However, the payoff is a system that is easier to understand, maintain, and improve. As organizations continue to rely on digital solutions, the ability to map their logic remains a critical asset.
Start with the basics. Define your boundaries. Decompose your processes. Review your work. With practice, creating these models will become second nature, leading to more robust and efficient information systems.