Understanding how information moves through a system is fundamental to system analysis and design. A Data Flow Diagram (DFD) provides a visual representation of this movement. Unlike technical blueprints that focus on code or database schemas, a DFD focuses on the flow of data and the processes that transform it. This guide details the essential symbols used to construct these diagrams, ensuring clarity and precision in your documentation.
What is a Data Flow Diagram? 🤔
A Data Flow Diagram is a structured analysis tool. It maps the sequence of information processing activities. It does not describe the logic of the system in terms of programming code. Instead, it illustrates what data is moved, where it comes from, where it goes, and how it changes. This abstraction allows stakeholders to understand the functional requirements without getting bogged down in technical implementation details.
DFDs are hierarchical. They start with a high-level overview and progressively break down into more detailed views. This decomposition helps manage complexity. By defining boundaries and interactions, analysts can identify gaps in requirements or potential bottlenecks before development begins.
The Four Core Symbols 🛠️
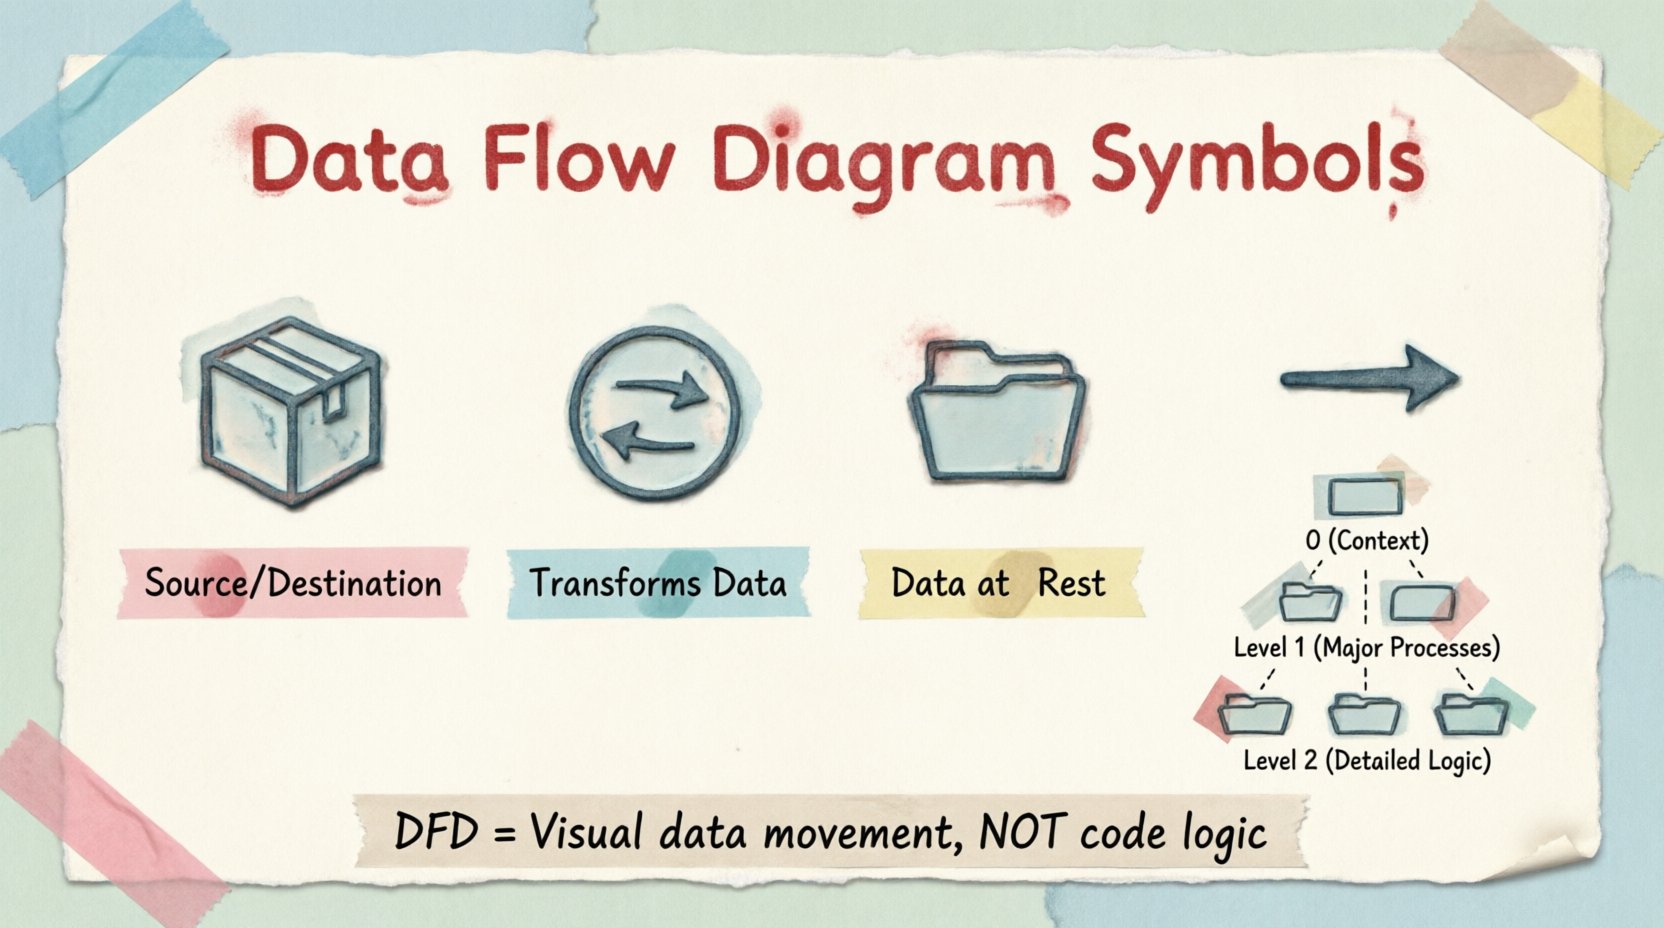
Standard DFD notation relies on four primary shapes. While variations exist between different methodologies (such as Yourdon/DeMarco or Gane/Sarson), the core concepts remain consistent. Each symbol represents a specific function within the system boundary.
| Symbol Name |
Visual Representation |
Function |
| External Entity |
Rectangle |
Source or Destination of data |
| Process |
Circle or Rounded Rectangle |
Transformation of data |
| Data Store |
Open Rectangle |
Storage of data at rest |
| Data Flow |
Arrow |
Movement of data |
1. External Entity 📦
External entities represent sources or destinations of data that lie outside the system being modeled. They are the actors that interact with the system but are not part of its internal logic. An entity can be a person, a group, another computer system, or a department.
Entities are typically drawn as rectangles. In some notations, they may appear as ovals. The key characteristic is that the system sends data to them or receives data from them. For example, a Customer is an entity. The system processes their order, but the Customer exists independently of the order processing software.
- Input: Data enters the system from the entity.
- Output: Data leaves the system and goes to the entity.
It is important not to confuse external entities with processes. An entity does not transform data; it merely originates or consumes it.
2. Process 🔄
Processes are the active elements of the diagram. They represent functions that transform input data into output data. A process is the work being done. It could be a calculation, a validation check, a decision, or a data manipulation routine.
Processes are usually drawn as circles or rounded rectangles. Inside the shape, you place a name that describes the action, such as “Calculate Total” or “Validate Login”. Every process must have at least one input and at least one output. A process that has data coming in but nothing going out is incomplete.
Processes are numbered to indicate hierarchy. For instance, “Process 1” might be broken down into “Process 1.1”, “Process 1.2”, etc. This numbering helps track detail levels across different diagrams.
3. Data Store 📁
Data stores represent places where data is held for future use. They are repositories. In a physical system, this might be a database table, a file, or a physical filing cabinet. In a logical diagram, it is simply where data rests.
Common shapes include open-ended rectangles or parallel lines. The name inside the store should be plural, indicating a collection of records, such as “Customer Files” or “Order Logs”.
- Read: A process reads data from a store to use it.
- Write: A process writes data to a store to save it.
Data flows into and out of stores. It is crucial to note that data flows do not cross without passing through a process. You cannot draw a direct line between two data stores; a process must sit in between to define why the data is moving.
4. Data Flow ➡️
Data flows are the arrows that connect the symbols. They represent the movement of data across the system. Unlike control flow in programming, data flow represents actual information packets.
Each arrow should be labeled with the name of the data moving through it. For example, an arrow from a Customer to a Process might be labeled “Order Request”. An arrow from a Process to a Data Store might be labeled “New Order Record”.
Arrows must have a single direction. If data moves both ways between two points, use two separate arrows. The label must be singular or plural consistently. Avoid vague labels like “Data” or “Information”. Be specific, such as “Shipping Address” or “Inventory Report”.
Understanding DFD Levels 📈
DFDs are created in layers to manage complexity. This approach is known as decomposition.
Level 0: The Context Diagram
The Level 0 diagram is the highest level. It shows the entire system as a single process. It highlights the relationship between the system and external entities. This view answers the question: “What is the system boundary?”
In this diagram, there is only one process node. All data flows connect external entities directly to this central process. There are no internal data stores shown at this level, as the internal workings are hidden.
Level 1: Major Processes
The Level 1 diagram explodes the single process from Level 0 into its major sub-processes. This breaks the system down into manageable chunks. You will see multiple process nodes, data stores, and the specific flows connecting them.
This level defines the main functional areas. For example, an e-commerce system might break down into “Manage Inventory”, “Process Payment”, and “Handle Shipping”. Each of these represents a major process.
Level 2: Detailed Logic
Level 2 diagrams dive deeper into specific processes from Level 1. If a Level 1 process is complex, it gets its own diagram. This allows analysts to map out every step of a specific function without cluttering the overall view.
At this stage, the notation becomes more granular. You might see multiple data stores and complex routing of data flows. This is where the specific business rules are often visualized.
Rules and Conventions ✅
To maintain clarity, DFDs must adhere to strict rules. Violating these rules can lead to confusion and misinterpretation.
Consistency in Naming
The same data flow must have the same name wherever it appears. If you label a flow “User ID” on one diagram, it cannot be “ID Number” on another. Consistency aids in tracing data across levels.
No Black Holes or Miracles
A “Black Hole” is a process with input but no output. This implies data disappears, which is usually incorrect. A “Miracle” is a process with output but no input. This implies data appears from nowhere. Both are logical errors in the diagram.
Data Store Balancing
When you decompose a process, the data stores connected to the parent process must remain connected to the child processes. You cannot delete a data store in a lower level unless the logic changes significantly. The flow of data must balance between levels.
Arrow Direction
Arrows indicate direction. Do not draw arrows that cross each other unnecessarily. Crossing lines make the diagram hard to read. Use bends or breaks to keep paths clear. If two flows cross, ensure the data types are distinct to avoid confusion.
DFD vs. Flowchart 🧩
It is common to confuse Data Flow Diagrams with Flowcharts. While they look similar, they serve different purposes.
A Flowchart describes the logic and sequence of operations. It shows decision points (diamonds), loops, and the exact order of steps. It is procedural. It answers “How does the system execute?”
A DFD describes the data movement. It does not show loops or decision logic explicitly. It focuses on the “What” and “Where” of data. It answers “What data is moved and transformed?”
Using a DFD for control logic is a mistake. It should not contain decision diamonds. If you need to show logic, use a decision table or a structured English description alongside the DFD. This separation of concerns keeps the diagram clean.
Practical Application 📝
When building a diagram, start with the Context Diagram. Identify the system boundary. Draw the external entities. Draw the single process representing the system. Draw the flows connecting them.
Next, move to Level 1. Break the central process into major functions. Identify where data is stored. Ensure every process has inputs and outputs. Check that the flows match the context diagram.
Review the diagram with stakeholders. Ask if the flows match their understanding of the business. If a stakeholder says, “We don’t store that data here,” adjust the data stores. If they say, “We don’t send data to that person,” adjust the entities.
Validation is key. A diagram that is not understood by the users is useless. It serves as a communication tool. It bridges the gap between technical teams and business owners.
Best Practices for Clarity 🌟
Keep the number of symbols on a single page manageable. If a diagram becomes too crowded, it loses its value. Use sub-diagrams to break it up. Do not try to show the entire system on one sheet if it exceeds the visual capacity.
Use standard notation. While there are variations, sticking to one style (e.g., Yourdon/DeMarco or Gane/Sarson) prevents confusion. Do not mix styles within the same document.
Label everything. Unlabeled arrows are meaningless. Unlabeled processes are ambiguous. Even simple shapes need names to convey meaning.
Avoid crossing lines. It creates visual noise. If lines must cross, use a “jump” or break in the line to indicate they do not intersect.
Summary of Symbol Semantics 📋
To recap the core components:
- Entity: Outside the system. Source or sink.
- Process: Inside the system. Transforms data.
- Store: Inside the system. Holds data.
- Flow: Connects the above. Moves data.
Mastering these symbols allows you to document complex systems clearly. It provides a shared language for analysts and developers. By adhering to the rules of decomposition and consistency, you create diagrams that are not just drawings, but functional specifications.
Start simple. Build the context. Expand the detail. Verify with users. This iterative process ensures the diagram reflects reality.