


Big projects — international conferences, major software launches, product rollouts — live or die by timing and dependencies. Manually sketching PERT charts, calculating forward/backward passes, and hunting for the critical path can eat days. Visual Paradigm’s AI changes that completely.
Describe your project once in plain language. Seconds later, you get a clean, professional PERT chart with tasks, dependencies, durations, and the critical path automatically highlighted. No more staring at blank pages. Just fast, accurate scheduling so you can focus on execution, risks, and stakeholder alignment.
Quick Wins You Get Right Away
- Text prompt → full PERT network diagram instantly
- Automatic critical path identification
- Three-point estimates (optimistic, most likely, pessimistic) built-in
- Desktop depth + browser chatbot speed
- Easy refinement into Gantt charts, resource allocation, or reports
1. Desktop – Zero to Professional Schedule in Seconds
In Visual Paradigm Desktop:
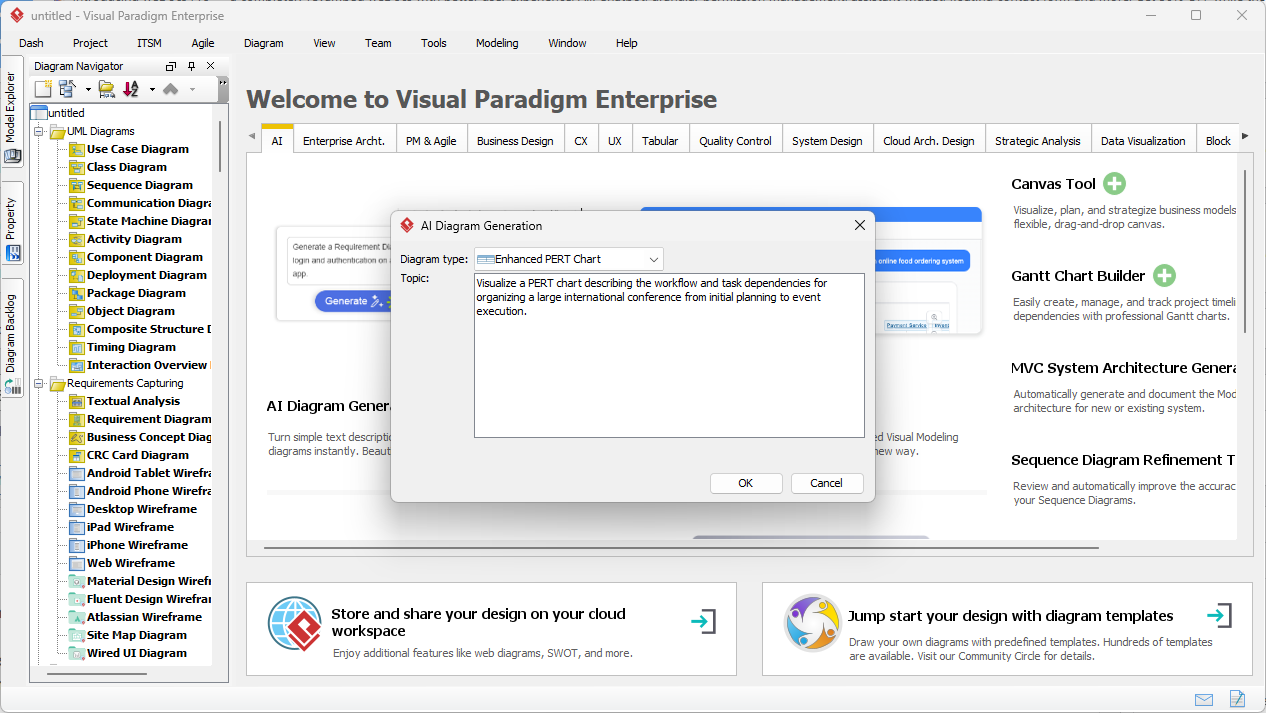
Tools → AI Diagram Generation → select “PERT Chart” → type your project:
“Create a PERT chart for organizing an international tech conference: venue booking, speaker invitations, marketing campaign, registration system, travel logistics, event execution, post-event reporting.”
The interface keeps everything simple:
The AI instantly builds:
- Logical phases: Planning, Marketing, Logistics, Execution
- Task nodes with IDs, durations, responsible persons (e.g., Alice, Bob)
- Dependencies (FS, SS, FF, SF) and calculated early/late times
- Critical path highlighted automatically
Resulting conference organization PERT chart — ready for review and tweaks:
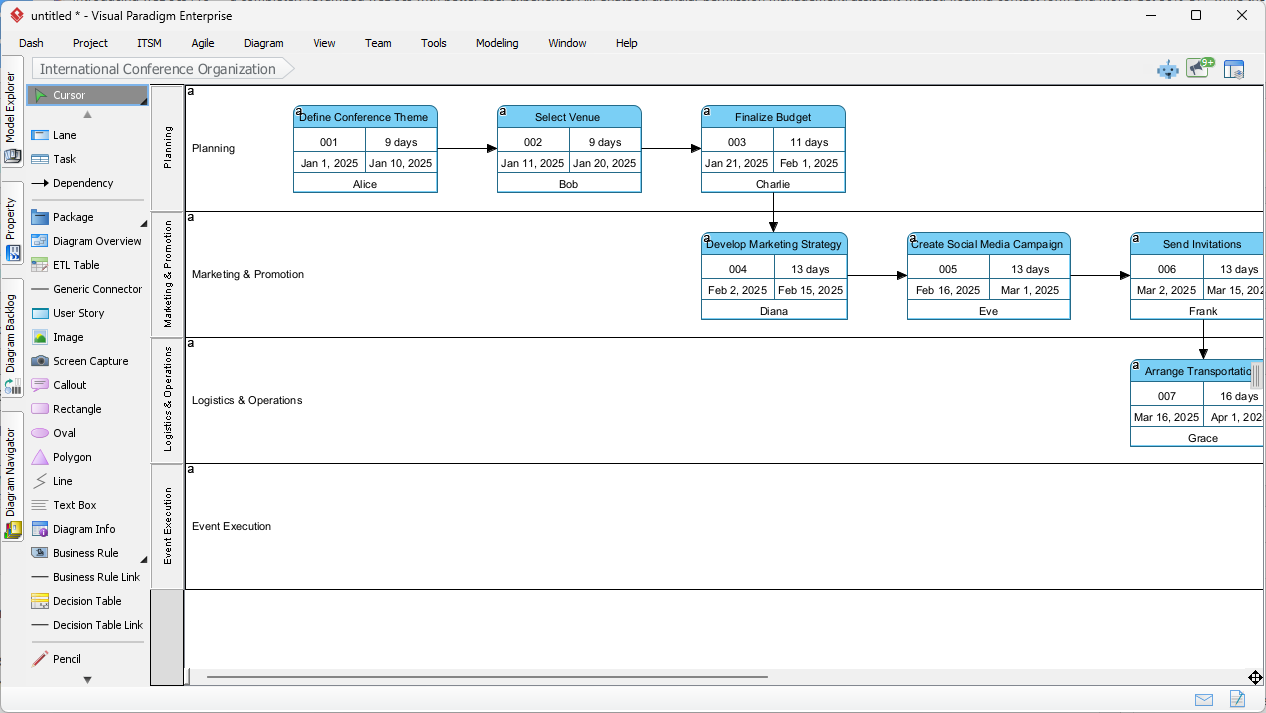
From here you can adjust durations, add lags, run what-if scenarios, and export to Gantt or PDF reports.
2. Chatbot – Brainstorm Anywhere, Anytime
On the go or in a meeting? Open the Visual Paradigm AI Chatbot in your browser.
Type:
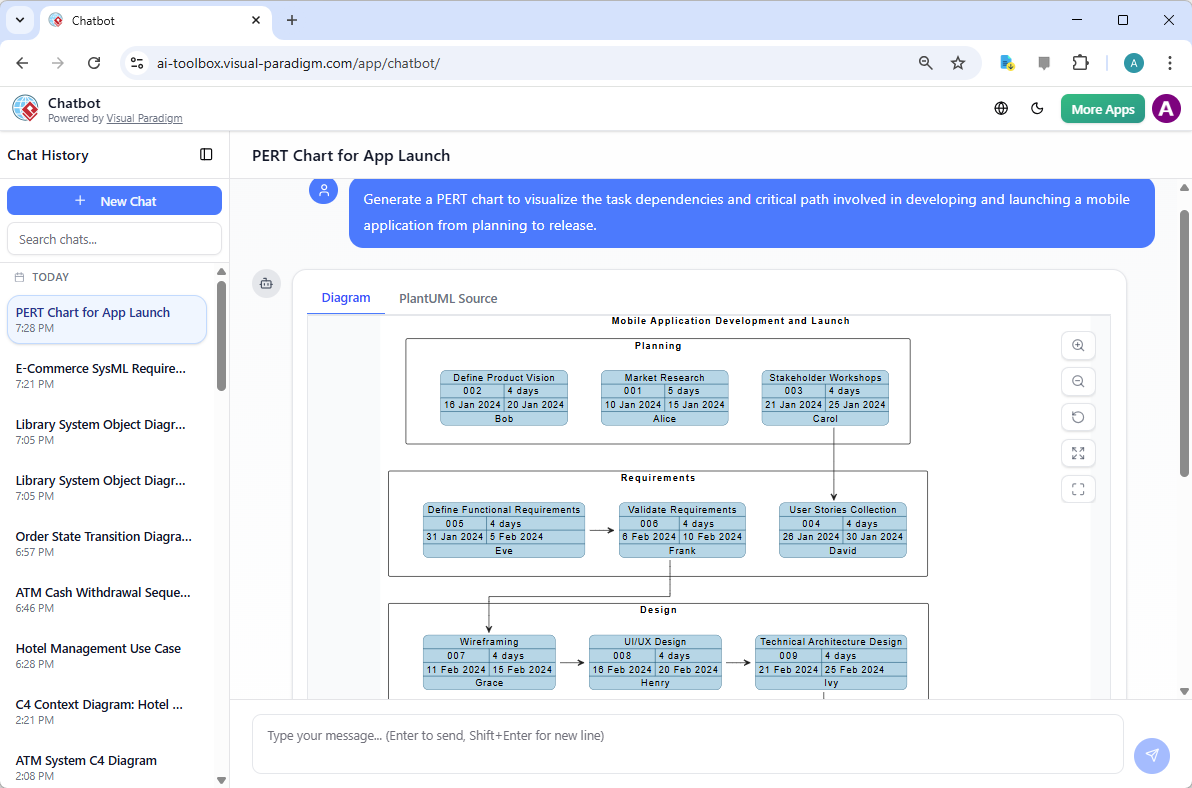
“Generate PERT chart for mobile app launch: market research, UI/UX design, development sprints, beta testing, marketing rollout, App Store submission.”
The chatbot understands sequence, creates nodes and arrows, computes the expected path, and shows you the diagram live. Refine it instantly:
“Add two-week delay risk to beta testing and show impact on launch date.”
Example output for a mobile app launch — clear, professional, and conversational:
Ideal for quick stakeholder alignment or exploring options without firing up the full desktop.
Why PERT + AI Is a Project Manager’s Superpower in 2026
Classic PERT math — forward pass, backward pass, slack/float calculation, three-point weighted average — is tedious and error-prone by hand.
Visual Paradigm’s AI does it all behind the scenes while you focus on strategy:
- Which tasks can slip without delaying launch?
- What happens if marketing gets an extra week?
- How much buffer do we really need for risky activities?
Change scope mid-planning? Update the description or chat → regenerate → new critical path instantly. That speed keeps projects agile and teams confident.
Two Practical Workflows to Steal
Fast Start Workflow
- Describe project in desktop or chatbot
- Generate PERT → review critical path
- Tweak durations/dependencies
- Export or share for approval
Risk Scenario Workflow
- Build optimistic version
- Regenerate with pessimistic estimates for high-risk tasks
- Compare total durations & bottlenecks
- Present risk-adjusted plan to leadership
Ready to Plan Smarter, Not Harder?
Visual Paradigm’s AI PERT chart generator is built for real-world projects — fast, accurate, standards-compliant, and flexible.
- Download Visual Paradigm Desktop → Full power for serious planning: Get Desktop Now
- Try AI Chatbot Online → Instant brainstorming: Start Chatting
Your next big launch or conference deserves better than manual spreadsheets. Give your project the head start it needs — today.
Related Links
The integration of artificial intelligence into project management workflows allows for the automated generation and optimization of PERT (Program Evaluation and Review Technique) charts directly from natural language prompts,. These resources explore how AI-powered tools and chatbots can instantly visualize task dependencies, estimate project timelines, and perform critical path analysis to identify potential bottlenecks,. By leveraging intelligent scheduling, specialized tutorials, and pre-built templates, teams can transform complex project requirements into structured, actionable plans for more efficient execution,,.
- Pert Chart Tool – Visual Paradigm Online: This tool provides a powerful environment for visualizing task dependencies and managing project schedules through an intuitive online interface.
- Enhanced PERT Chart Features – Visual Paradigm: Users can utilize advanced capabilities such as critical path analysis and dynamic scheduling to optimize project timelines.
- Complete PERT Chart Tutorial – Visual Paradigm: This step-by-step guide teaches users how to create and use PERT charts to plan and manage complex projects efficiently.
- Integrating PERT Charts with RACI Roles in Task Management: This article explores how to combine PERT charts with RACI matrices to improve accountability and accuracy in task planning.
- Pert Chart for Project Management – Cybermedian: This resource offers practical insights and real-world examples of applying PERT charts to enhance project management.
- AI Chatbot for Diagram and Model Generation: This interactive AI interface enables users to generate a variety of models, including project management diagrams, using simple natural language input.
- Pert Chart User Guide – Visual Paradigm: This official documentation provides detailed technical instructions on creating and editing PERT charts within a professional modeling environment.
- Free PERT Chart Templates – Visual Paradigm: Access a library of professionally designed templates to speed up project planning with minimal manual setup.
- PERT Chart Example: Software Development Example: This practical example demonstrates the use of PERT charts specifically for organizing and tracking software development tasks.
- Automatic Diagram Generation in Visual Paradigm: This guide explains how to use automation and AI features to generate diagrams instantly from existing project models or data.