System architecture is not merely about writing code that functions; it is about designing structures that endure, scale, and communicate clearly across distributed teams. As developers progress into senior roles, the focus shifts from individual component logic to the interactions between those components. This is where the communication diagram becomes an indispensable asset. Unlike static documentation, these visual representations provide a dynamic view of object interactions, message flows, and system states within a specific scenario. For senior engineers, mastering the nuances of communication diagrams means moving beyond basic object connections to modeling complex behaviors, concurrency, and failure states.
This guide explores advanced techniques for utilizing communication diagrams effectively in large-scale software environments. We will examine how to manage complexity, handle distributed system concerns, and maintain documentation that serves as a living reference rather than a static artifact. The goal is to equip you with the strategies needed to visualize system behavior with precision and clarity.
Understanding the Core Utility of Communication Diagrams 🧩
A communication diagram, often referred to as a collaboration diagram in older UML specifications, focuses on the relationships between objects. While sequence diagrams emphasize the timeline of messages, communication diagrams prioritize the structural context of those interactions. This distinction is critical when analyzing how data flows through a system architecture.
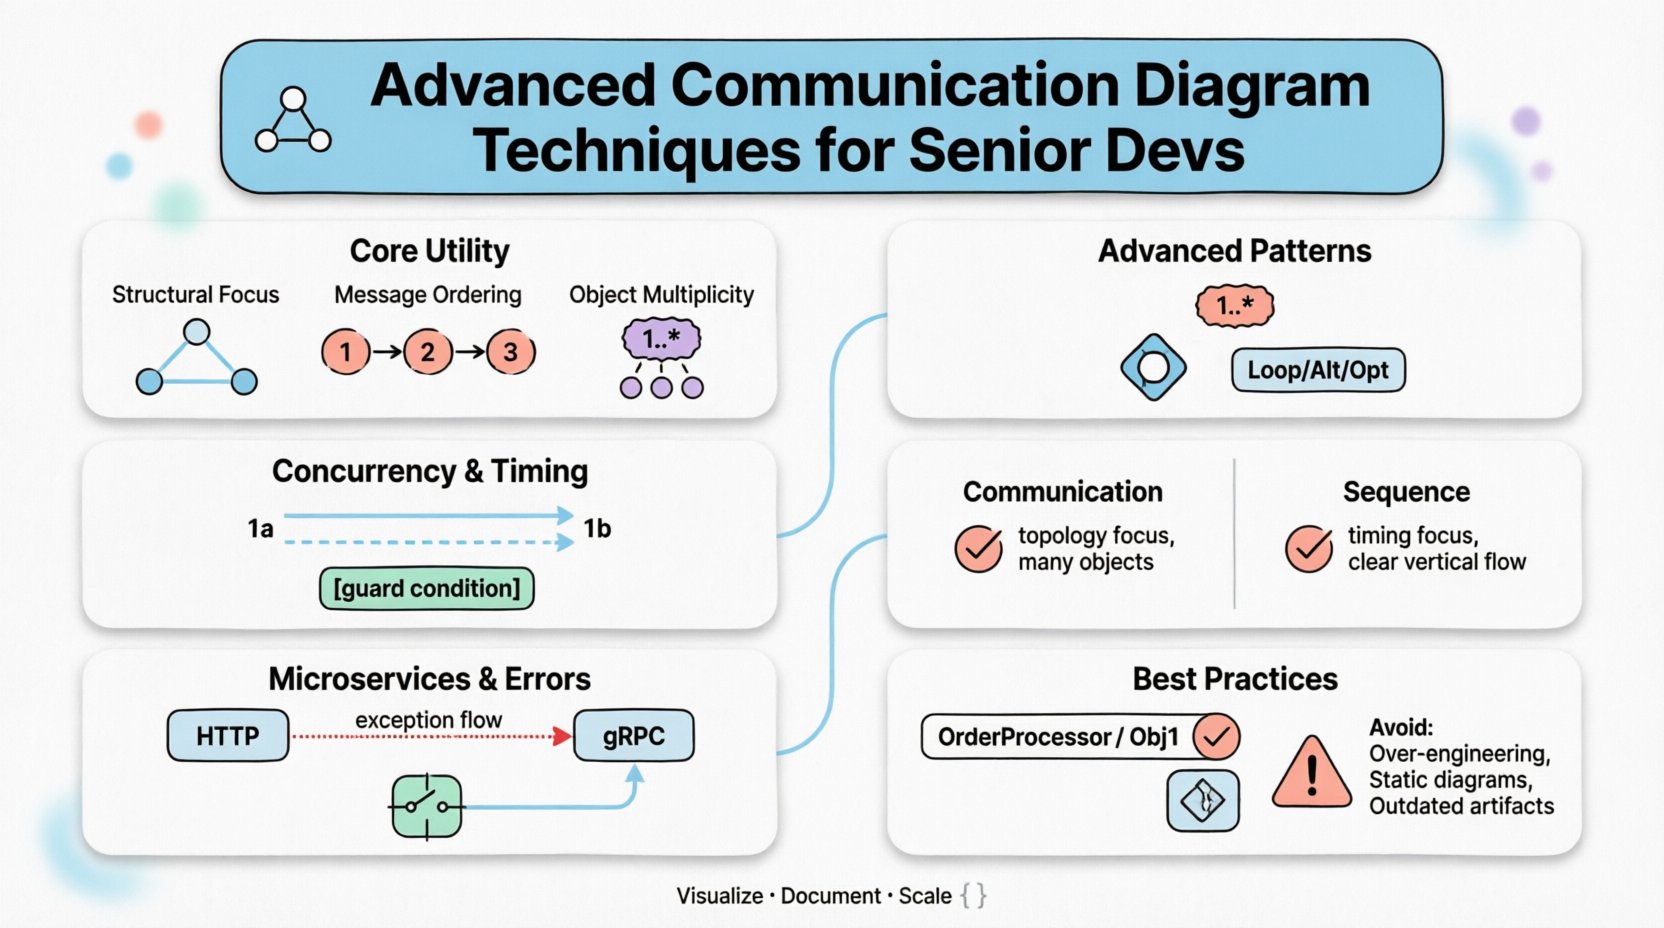
- Structural Focus: It shows the static links between objects, making it easier to see the topology of the interaction.
- Message Ordering: Numbers are assigned to messages to indicate the sequence of execution, replacing the vertical time axis of sequence diagrams.
- Object Multiplicity: It clearly depicts how many instances of an object participate in the interaction, which is vital for understanding scalability.
For senior developers, the value lies in the ability to abstract complex flows without getting bogged down in every single millisecond of execution. This allows for high-level architectural reviews and quick identification of bottlenecks in object coupling.
Advanced Structural Patterns for Complex Systems ⚙️
In enterprise-level applications, simple linear flows are rare. Systems often involve branching logic, loops, and conditional execution. Advanced communication diagrams must represent these patterns without becoming illegible.
Managing Object Multiplicity
One of the most common challenges in scaling diagrams is handling multiple instances of the same object. Instead of drawing every single instance, senior engineers use multiplicity markers and aggregation symbols to denote collections.
- Cardinality: Use notation like
1..*to indicate one or more instances involved in the interaction. - Aggregation: Distinguish between strong ownership and weak association using diamond shapes to show how objects are grouped.
- Role Labels: Assign specific roles to objects (e.g., Producer, Consumer) to clarify their function regardless of how many instances exist.
Nesting and Fragmentation
When a diagram becomes too crowded, it loses its utility. Fragmentation allows you to break a complex interaction into manageable sub-diagrams.
- Combined Fragments: Use frames to encapsulate specific behaviors like Loop, Alt (Alternative), or Opt (Optional).
- Named Frames: Give each fragment a descriptive name that corresponds to a specific business rule or service capability.
- Reference Points: Use notes or links to indicate that a sub-diagram is detailed further elsewhere, maintaining the high-level overview.
Timing and Concurrency Considerations ⏱️
While communication diagrams are not primarily timing diagrams, senior engineers must understand how concurrency affects message ordering. In distributed systems, the order of operations can determine data consistency.
Representing Concurrency
When multiple threads or services process messages simultaneously, standard linear numbering can be misleading. Advanced techniques include:
- Parallel Execution Marks: Use distinct numbering sets (e.g., 1a, 1b) to show messages that occur in parallel rather than sequentially.
- Timeout Indicators: Explicitly mark where a message might time out, indicating a potential failure path that needs handling.
- Asynchronous Labels: Distinguish between synchronous calls (blocking) and asynchronous events (fire-and-forget) using different arrow styles or labels.
Handling State Changes
Objects in a system are rarely static. They transition between states based on the messages they receive. A senior-level diagram captures these state transitions implicitly or explicitly.
- State Symbols: Indicate the state of an object before and after a message is processed.
- Guard Conditions: Add text conditions to arrows (e.g., [user is authenticated]) to show prerequisites for a message flow.
- Persistence Points: Highlight where data is saved to a database versus kept in memory, as this impacts performance and reliability.
Communication vs. Sequence Diagrams: Choosing the Right Tool 🆚
Choosing between a communication diagram and a sequence diagram depends on the specific question you are trying to answer. Both serve the purpose of modeling interactions, but their strengths differ.
| Feature | Communication Diagram | Sequence Diagram |
|---|---|---|
| Primary Focus | Object relationships and structure | Time sequence and ordering |
| Best For | Understanding topology and coupling | Understanding timing and latency |
| Complexity | Better for many objects, fewer messages | Better for few objects, many messages |
| Readability | Can be hard to follow if too many lines cross | Clear vertical flow, easy to trace |
| Scalability | High (can use aggregation) | Medium (vertical space limits depth) |
Senior developers often use both in tandem. A communication diagram provides the map of the territory, while a sequence diagram fills in the specific path taken during a critical operation.
Distributed Systems and Microservices ☁️
Modern architectures frequently rely on microservices, where objects are no longer in the same memory space. This introduces network latency, serialization, and potential points of failure. Communication diagrams must adapt to reflect these realities.
Boundary Crossing
When a message crosses a service boundary, it is no longer a method call; it is a network request. Advanced diagrams reflect this distinction.
- Protocol Labels: Specify the protocol used (e.g., HTTP, gRPC, AMQP) on the connecting link.
- Request/Response Pairs: Clearly group the request message and the response message to show the round-trip nature.
- Service Boundaries: Use boxes or shaded regions to visually separate different microservices or logical layers.
Error Handling Visualization
In a distributed environment, failure is a certainty, not an exception. A robust diagram includes paths for error handling.
- Exception Flows: Draw dotted lines or distinct colored arrows to represent error propagation.
- Retry Logic: Indicate if a message is retried and under what conditions.
- Circuit Breakers: Note where a service stops forwarding requests to prevent cascade failures.
Documentation Standards for Teams 📝
Diagrams are a form of communication between engineers. If the team cannot understand them, the diagram has failed. Establishing standards ensures consistency across the codebase.
Naming Conventions
Consistent naming prevents ambiguity. Every object and link should have a clear, descriptive name.
- Object Names: Use noun phrases that reflect the domain entity (e.g., OrderProcessor instead of Obj1).
- Message Names: Use verb phrases that describe the action (e.g., validatePayment instead of msg1).
- Link Names: If multiple links exist between objects, label them to distinguish their purpose (e.g., primary, backup).
Version Control Integration
Just like code, diagrams change. They should be versioned and tracked.
- Single Source of Truth: Store diagram definitions in a text format (like PlantUML or Mermaid) rather than binary image files to allow diffing.
- Commit Messages: Explain the architectural change in the commit message, not just the visual change.
- Review Process: Include diagram updates in code review pull requests to ensure logic matches implementation.
Common Pitfalls to Avoid ⚠️
Even experienced engineers can fall into traps that reduce the value of their diagrams. Awareness of these pitfalls helps maintain quality.
- Over-Engineering: Do not model every edge case. Focus on the happy path and major exception paths. Too much detail obscures the main flow.
- Static vs. Dynamic: Do not confuse the static class structure with the dynamic interaction flow. A communication diagram is about the latter.
- Ignoring Performance: A diagram that looks good logically might be terrible for performance (e.g., N+1 query patterns). Always annotate performance constraints.
- Orphaned Objects: Every object in the diagram should be connected to the flow. Unconnected objects confuse the reader.
- Outdated Artifacts: If the code changes, the diagram must change. Stale diagrams are worse than no diagrams because they mislead.
Maintainability and Long-Term Value 🔄
The lifespan of a software project is long, but the lifespan of a diagram is often short. To ensure longevity, adopt strategies that make diagrams easier to update.
Abstraction Layers
Create multiple levels of diagrams. A high-level view shows the system architecture, while detailed views focus on specific modules. This prevents the main diagram from becoming cluttered.
- Level 1: System-wide context and external interfaces.
- Level 2: Internal service interactions.
- Level 3: Specific algorithm or method flows.
Automated Generation
Where possible, generate diagrams from the code or API definitions. This reduces the gap between documentation and reality.
- API Specs: Use OpenAPI or AsyncAPI specifications to generate interaction diagrams automatically.
- Code Annotations: Use comments in the code to trigger diagram generation tools.
- CI/CD Integration: Run diagram generation as part of the build pipeline to ensure they always reflect the current state.
Conclusion on Architectural Clarity
Advanced communication diagram techniques are not just about drawing pretty pictures; they are about rigorous thinking. They force the engineer to consider the connections, the data flow, and the responsibilities of every component. For senior developers, this skill bridges the gap between abstract design and concrete implementation. By focusing on structure, managing complexity, and adhering to clear standards, you create documentation that supports the system throughout its lifecycle.
The path to mastery involves continuous refinement. Regularly review your diagrams against the actual running system. Update them when the architecture evolves. Treat them as critical infrastructure for knowledge transfer. In doing so, you ensure that the system remains understandable, even as it grows in size and complexity.