
Mastering UML Sequence Diagrams: The ‘Place Order’ Flow in Visual Paradigm
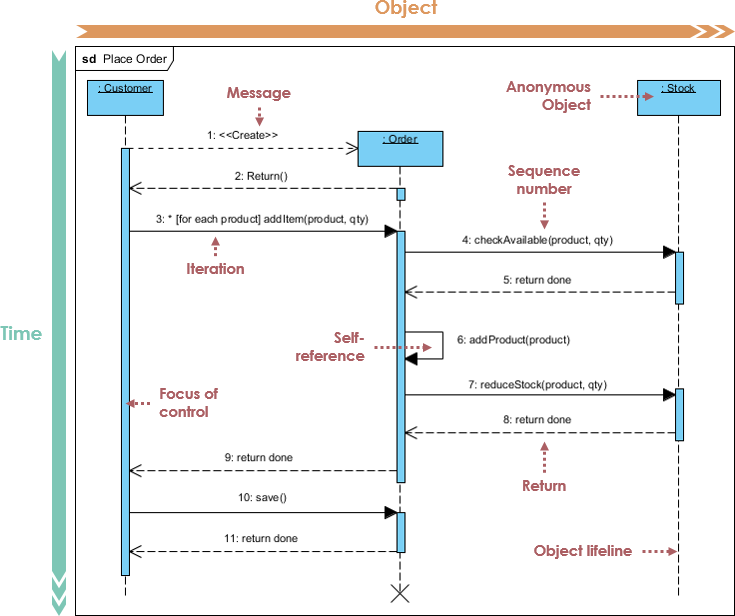
In the world of software architecture, few diagrams are as critical for understanding system behavior over time as the Sequence Diagram. It provides a dynamic view of how objects interact to achieve a specific goal. Today, we will break down a classic e-commerce scenario: the Place Order flow. This tutorial will guide you through the architecture, the specific modeling elements shown in the diagram, and how to implement this using Visual Paradigm.
Understanding the System Actors and Lifecycle
Before diving into the interaction flow, we must identify the participants in our system. A sequence diagram is built upon lifelines—vertical dashed lines representing objects or actors that exist over time. In our ‘Place Order’ scenario, we have three distinct participants:
- Customer: The initiator of the process. In a real-world application, this could represent a user session or a client-side controller object.
- Order: The central object handling the transaction. It acts as the coordinator, managing the collection of items and ensuring the data is saved correctly.
- Stock: A supporting service or object responsible for inventory management. It ensures that what the customer wants is actually available.
The diagram illustrates the complete lifecycle of the Order object, from its creation by the Customer, through its complex interactions with the Stock system, to its final destruction once the transaction is complete.
Step-by-Step Interaction Analysis
Let’s trace the execution flow chronologically. Time flows from top to bottom, indicated by the vertical green arrow on the left.
1. Object Creation and Initialization
The process begins when the Customer initiates the transaction. This is represented by the dashed arrow labeled 1: <<Create>>.
- Message: The Customer sends a request to create a new Order object.
- Return: The Order object is instantiated and returns a reference (indicated by message
2: Return()) to the Customer, allowing the Customer to begin adding items.
2. Iteration and Inventory Checks
Once the Order exists, the Customer adds items. The diagram uses a combined fragment (the box with the label 3: *[for each product] addItem(product, qty)) to represent a loop or iteration. This means the subsequent steps repeat for every single item in the shopping cart.
Inside this loop, a critical validation process occurs involving the Stock system:
- Availability Check: The Order sends a synchronous message
4: checkAvailable(product, qty)to the Stock object. - Confirmation: The Stock object checks its database and returns a success status
5: return done. - Self-Reference: Before modifying external stock, the Order object updates its own internal state (adding the product to its list) via message
6: addProduct(product). This is a Self-reference, where an object calls a method on itself. - Inventory Reduction: Finally, the Order instructs the Stock system to reserve the item using
7: reduceStock(product, qty). The Stock object confirms this with8: return done.
3. Finalization and Cleanup
Once the loop completes (all items are checked and added), the process moves to the finalization phase:
- Save: The Customer triggers the
10: save()message on the Order object. This likely persists the transaction to a database. - Destruction: The diagram ends with a small cross (X) at the bottom of the Order lifeline. This signifies that the Order object is destroyed or the interaction is terminated, freeing up system resources.
Visualizing Focus of Control
You will notice blue rectangular bars on the lifelines, known as Focus of Control (or Activation Bars). These bars indicate the period during which an object is performing an action or is actively waiting for a response.
- When the Order object is active, the blue bar is visible.
- When the Stock object receives the
checkAvailablemessage, its activation bar lights up, showing it is busy processing that request.
Implementing this Model with Visual Paradigm
To recreate this architecture yourself, Visual Paradigm offers a robust set of tools. The diagram you are analyzing was generated using their intuitive drag-and-drop interface.
Here is how you would approach building this in Visual Paradigm:
- Define Participants: Start by creating the three classes: Customer, Order, and Stock in your Class Diagram, then link them to the Sequence Diagram.
- Add Messages: Use the “Create Message” tool to draw the synchronous calls (solid arrows) and return messages (dashed arrows).
- Configure Iteration: Right-click the message
addItemand select “Create Combined Fragment.” Choose the “Loop” operator to wrap the interaction logic for multiple products. - Style and Annotate: Utilize Visual Paradigm’s styling features to add the specific annotations shown in the image, such as the
<<Create>>stereotype or theSelf-referencelabel.
By mastering these elements, you ensure that your system architecture is not just a static picture, but a dynamic, executable blueprint of your software’s logic.