


Understanding how systems behave is fundamental to engineering and design. Whether you are modeling a complex software workflow, defining the logic of an embedded device, or mapping out a user journey, visualizing states and transitions is crucial. A state diagram, often referred to as a State Machine Diagram, provides this clarity. It moves beyond static structure to describe dynamic behavior. This guide addresses the most common inquiries regarding these diagrams, breaking down technical concepts into digestible insights.
We will explore what these diagrams represent, how they differ from other models, and the specific components required to build them correctly. By the end, you will have a solid grasp of state modeling without needing to navigate unnecessary jargon.
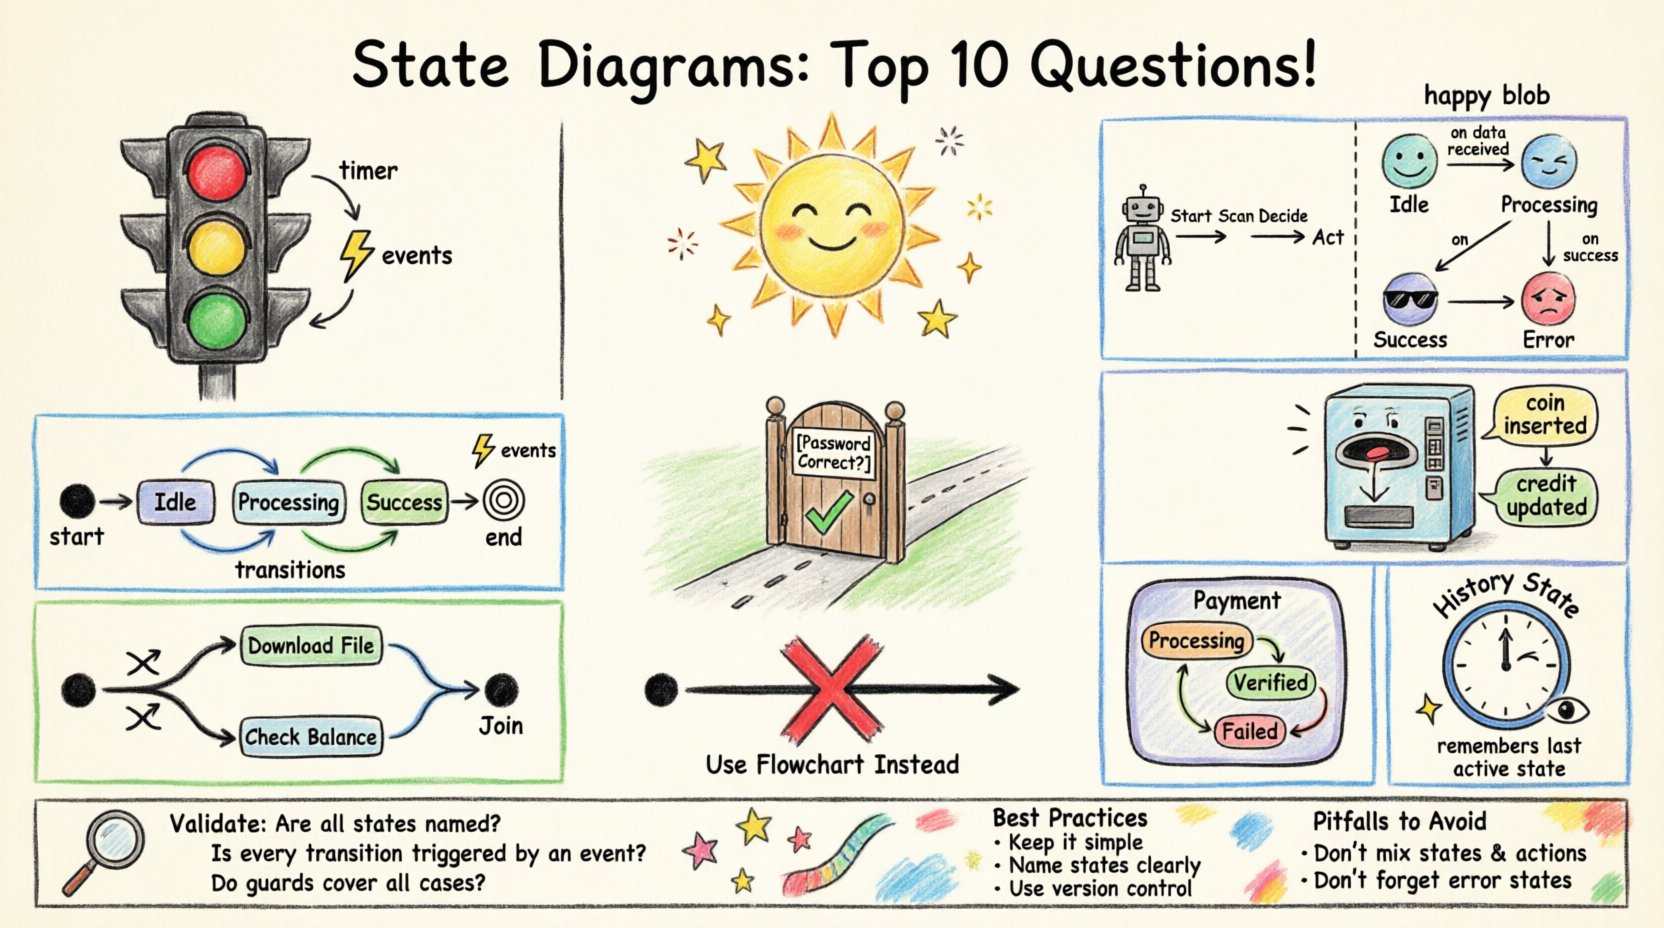
1. What exactly is a State Diagram? 🤔
A state diagram is a graphical representation of the behavior of a single object or system. It shows the different conditions, or states, an entity can exist in, and how it moves from one condition to another. Think of it as a map of the system’s life cycle.
- States: These are the distinct conditions during the object’s life. For example, a traffic light can be in a “Red”, “Yellow”, or “Green” state.
- Transitions: These are the links that connect states. They indicate movement from one state to another.
- Events: These are the triggers that cause a transition to occur.
Unlike a flowchart, which focuses on the sequence of actions, a state diagram focuses on the status of the object at any given moment. This distinction is vital for systems where the history of actions matters less than the current configuration.
2. How does a State Diagram differ from a Flowchart? 🔄
While both tools visualize processes, their purpose and structure differ significantly. Confusing the two can lead to flawed system designs. Here is a breakdown of the key differences:
| Feature | Flowchart | State Diagram |
|---|---|---|
| Focus | Process flow and logic steps | Object status and behavior |
| Nodes | Actions, decisions, start/end points | States (conditions) |
| Flow | Sequential execution | Event-driven transitions |
| Context | Algorithm or procedure | Entity lifecycle |
If you are documenting a user registration process step-by-step, a flowchart is appropriate. If you are defining the lifecycle of a “User Account” object (e.g., New, Active, Suspended, Deleted), a state diagram is the correct tool.
3. What are the essential components? 🧱
To construct a valid state diagram, you need specific symbols and notations. Each component serves a unique function in defining the system’s logic.
- Initial State: Represented by a solid black circle. It marks the beginning of the process.
- Final State: Represented by a solid circle surrounded by a ring. It marks the termination of the process.
- State: Represented by a rounded rectangle. It holds the name of the condition (e.g., “Processing”, “Idle”).
- Transition: Represented by an arrow. It connects states and indicates direction.
- Event: Written near the transition arrow. It specifies what triggered the move.
Missing any of these can make the diagram ambiguous. For instance, without an initial state, the starting point is undefined. Without a final state, the system might appear to run indefinitely.
4. What is the difference between an event and an action? ⚡
Confusion often arises between the trigger (event) and the response (action). In state modeling, precision here is key to logic integrity.
- Event: Something that happens at a specific point in time. It triggers the transition. Examples include “User Clicks Button”, “Timer Expires”, or “Data Received”.
- Action: The activity performed during or after a transition. Actions are often associated with entry, during, or exit behaviors of a state.
Consider a vending machine. The event is “Coin Inserted”. The action is “Credit Updated”. The event causes the state to potentially change, while the action is the work done as a result.
5. How do guard conditions work? 🚧
Not every event leads to a transition. Sometimes, a transition only occurs if a specific condition is met. This is where guard conditions come into play.
- Definition: A boolean expression evaluated when the event occurs.
- Notation: Written in square brackets
[ ]next to the transition arrow. - Function: If the condition is true, the transition happens. If false, the transition is ignored.
For example, in a login system, the transition from “Logged Out” to “Logged In” might have a guard condition [Password Correct]. If the password is incorrect, the system stays in the “Logged Out” state despite the event “Login Attempt”.
6. What are Composite States? 📂
Complex systems often require states that contain other states. This is known as a composite state or nested state.
- Hierarchy: A composite state acts as a container for sub-states.
- Abstraction: It allows you to hide complexity. You can treat the composite state as a single unit from the outside.
- Entry/Exit: When entering a composite state, the default sub-state is activated.
Imagine a “Payment” state. Inside this state, you might have sub-states like “Processing”, “Verified”, and “Failed”. From the perspective of the parent state, the system is simply “Paying”. This hierarchy prevents the diagram from becoming a tangled web of lines.
7. How do you handle concurrent behavior? 🔄⚡
Some systems operate in parallel. A user might be “Downloading” while simultaneously “Checking Balance”. This is modeled using orthogonal regions within a single state.
- Split: A thick black line indicates a fork (splitting into multiple regions).
- Join: A thick black line indicates a join (merging regions back together).
- Regions: Separate areas inside a composite state where independent state machines run.
This is essential for multi-threaded applications or systems where independent processes must run at the same time. Without orthogonal regions, you might incorrectly model these processes as sequential, leading to performance bottlenecks in your design.
8. What is a History State? 🕰️
Sometimes, a system needs to remember where it left off before exiting a composite state. This is the purpose of a history state.
- Deep History: Represented by an ‘H’ in a circle. It returns the system to the last active sub-state.
- Shallow History: Represented by an ‘H’ in a circle (often distinguished by context). It returns the system to the initial sub-state of the parent.
Example: If a user exits the “Settings” state while in the “Privacy” sub-state, and then returns to “Settings” later, a history state ensures they return to “Privacy” rather than the default “General” sub-state. This preserves user context and improves the experience.
9. When should you NOT use a State Diagram? 🚫
While powerful, state diagrams are not a universal solution. Overuse can complicate simple problems.
- Simple Linear Processes: If there is only one path from start to finish, a flowchart or sequence diagram is clearer.
- Data Structures: If you are modeling database schemas or object attributes, use a Class Diagram.
- High-Level Architecture: For system topology, use an Architecture Diagram.
If your model has hundreds of states and transitions without clear hierarchy, it may be a sign that the logic is too complex for a state diagram. Refactoring the underlying logic is often better than drawing more lines.
10. How do you validate a State Diagram? ✅
Once drawn, a diagram must be tested against requirements to ensure accuracy. Validation ensures the model matches reality.
- Reachability: Can every state be reached from the initial state?
- Liveness: Is there any state where the system gets stuck (deadlock)?
- Completeness: Are all possible events accounted for? What happens if an unexpected event occurs?
- Consistency: Do the actions and guard conditions align with the business rules?
Reviewing the diagram with stakeholders is a critical step. They can identify missing edge cases, such as what happens if a network timeout occurs during a transaction. This human review complements the technical validation of the logic.
Best Practices for Maintenance 🛠️
Maintaining a state diagram over time is often as important as creating it. As requirements change, the diagram must evolve.
- Keep it Simple: Use state nesting to manage complexity. Avoid long chains of simple states that can be merged.
- Standardize Naming: Use consistent naming conventions for states and events to improve readability.
- Version Control: Treat the diagram as code. Track changes to understand how the logic evolved.
- Documentation: Add notes to explain complex logic that cannot be represented graphically.
By adhering to these practices, you ensure that the diagram remains a useful reference throughout the project lifecycle. It becomes a living document that guides development and testing.
Common Pitfalls to Avoid ⚠️
Even experienced designers can fall into traps when modeling behavior. Being aware of common mistakes helps in creating robust diagrams.
- Mixing States and Actions: Do not label a state with an action (e.g., “Deleting Data”). A state should be a condition (e.g., “Deleting”).
- Missing Error States: Every process needs a way to handle failure. Ensure states like “Error” or “Timeout” exist.
- Over-Engineering: Do not model every minor UI interaction as a state. Focus on the core logic of the object.
- Ignoring Entry/Exit Actions: Failing to specify what happens when entering or leaving a state can lead to inconsistent data.
Addressing these pitfalls early saves significant time during the implementation phase. It reduces the likelihood of bugs caused by misunderstood logic flows.
Conclusion on State Modeling 🎯
State diagrams are a powerful tool for defining system behavior. They provide a clear view of how an object responds to events over time. By understanding the components, transitions, and conditions, you can design systems that are reliable and predictable.
The key lies in balancing detail with clarity. Use composite states to manage complexity, guard conditions to enforce logic, and history states to preserve context. Avoid using them for tasks better suited to other diagram types. With careful planning and validation, these diagrams serve as a blueprint for robust software and system architecture.
Whether you are designing a simple embedded controller or a complex enterprise application, the principles remain the same. Focus on the states, define the transitions clearly, and validate against your requirements. This disciplined approach leads to better outcomes and fewer surprises during deployment.
Remember, the goal is clarity. If a diagram is confusing, it is not serving its purpose. Simplify, iterate, and ensure that every element on the page adds value to the understanding of the system.