


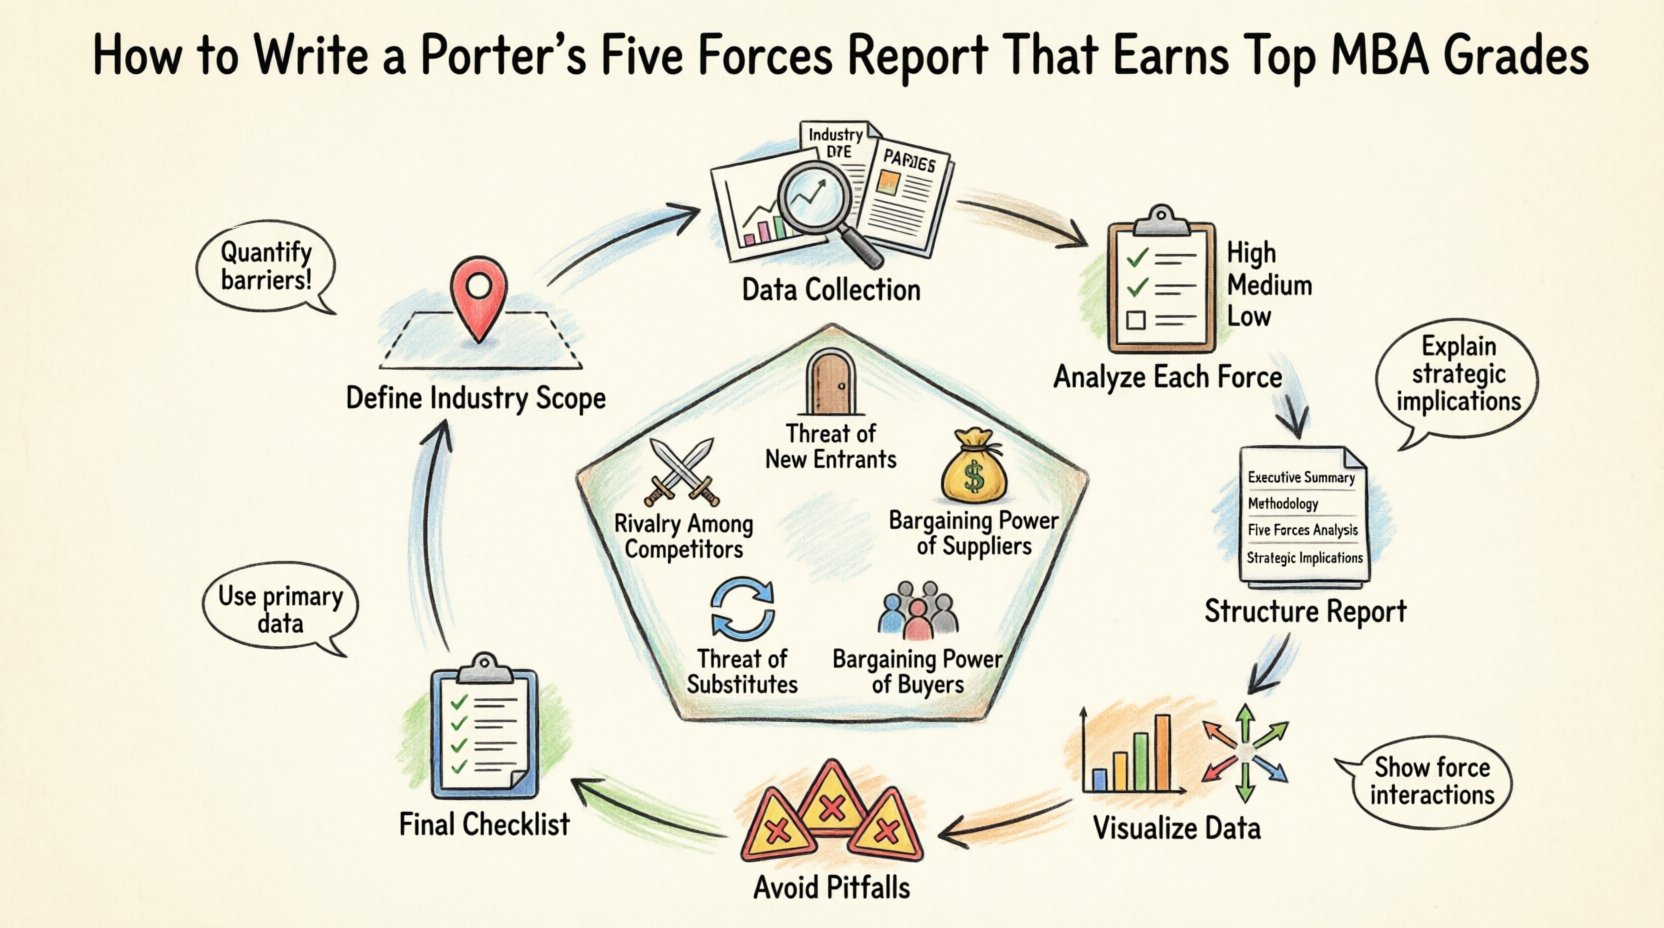
Entering an MBA program brings a specific set of academic challenges. Among the most common assignments is the strategic analysis of an industry using Michael Porter’s framework. A standard report often falls short because it describes the forces without synthesizing their impact on profitability. To achieve top grades, you must demonstrate critical thinking, rigorous data sourcing, and clear strategic implications. This guide outlines the exact process required to produce a high-scoring Porter’s Five Forces analysis. 🚀
Understanding the Framework Before You Begin 🧠
Many students treat the Five Forces as a checklist rather than a dynamic system. The goal of the assignment is not merely to list the forces but to explain how they interact to determine the long-term attractiveness of an industry. Professors look for evidence that you understand the underlying economics of the sector.
Before writing a single word, ensure you have a clear definition of the industry scope. Is it the global market for electric vehicles, or specifically the North American battery supply chain? A vague scope leads to vague analysis. A precise scope allows for specific data points. Graders prefer specificity.
- Define Boundaries: Clearly state the geographic and product boundaries.
- Identify the Profit Pool: Where does the value accrue in this industry?
- Focus on Dynamics: How are these forces changing over time?
The framework itself consists of five distinct forces. Each represents a source of pressure that can reduce industry profitability. Your job is to measure the intensity of these pressures. High intensity means lower potential returns. Low intensity suggests room for strategic maneuvering. ⚖️
Data Collection Strategy for Academic Rigor 📊
Top grades depend heavily on the quality of your sources. Descriptions based on opinion or general knowledge will result in lower marks. You need primary data, industry reports, and financial statements.
Sourcing Your Information
- Financial Statements: Review 10-K filings of major players to understand cost structures and margins.
- Industry Reports: Look for data from reputable market research firms regarding market size and growth rates.
- Regulatory Filings: Check government databases for licensing barriers or antitrust cases.
- Company Presentations: Investor slides often reveal strategic priorities and competitive concerns.
Avoid relying on news articles for core data. News provides context, but financial reports provide the hard numbers needed for a robust analysis. If you cannot find specific data for a force, acknowledge the limitation. Transparency regarding data gaps shows maturity.
Analyzing the Five Forces in Detail 🔍
Each force requires a unique approach to analysis. Below is a breakdown of what to look for in each category to ensure comprehensive coverage.
1. Threat of New Entrants 🚪
This force measures how easy it is for competitors to enter the market. If entry is easy, incumbents face constant pressure to lower prices. If entry is difficult, incumbents enjoy higher margins.
When analyzing this force, consider the following barriers:
- Capital Requirements: How much money is needed to start operations?
- Regulatory Hurdles: Are there licenses or permits required?
- Access to Distribution: Can new players reach customers easily?
- Proprietary Technology: Are there patents protecting key processes?
- Switching Costs: How hard is it for customers to move to a new provider?
For an MBA report, do not just list these barriers. Explain their magnitude. For example, is the capital requirement $1 million or $1 billion? Does a regulatory change in the last year make entry easier or harder? Quantifying the barrier strength is crucial.
2. Bargaining Power of Suppliers 💰
Suppliers can squeeze profitability by raising prices or reducing quality. Power is high when there are few suppliers, or when the product they provide is unique.
Evaluate supplier power using these criteria:
- Concentration: Is the supply market fragmented or oligopolistic?
- Differentiation: Is the input standardized or specialized?
- Switching Costs: How costly is it to change suppliers?
- Forward Integration: Can suppliers start making the final product themselves?
Consider the relationship between the supplier and the industry. If the supplier industry is more profitable than the target industry, they likely hold significant power. This dynamic often dictates pricing strategies for the entire sector.
3. Bargaining Power of Buyers 👥
Buyers drive prices down when they have leverage. High buyer power erodes margins. This force is distinct from the threat of new entrants; it focuses on the current customer base.
Key indicators of buyer power include:
- Concentration of Buyers: Are there few large customers or many small ones?
- Volume of Purchases: Does the buyer purchase a large percentage of the seller’s output?
- Price Sensitivity: How responsive is demand to price changes?
- Availability of Information: Do buyers know the costs and alternatives clearly?
- Threat of Backward Integration: Can buyers start making the product themselves?
In B2B contexts, buyer power is often the dominant force. In B2C contexts, it depends on brand loyalty and switching costs. Your analysis must reflect the specific business model of the companies you are studying.
4. Threat of Substitutes 🔄
Substitutes are products from different industries that satisfy the same need. This force sets a ceiling on prices. If prices rise too high, customers will switch to the alternative.
Look for these signals of substitution risk:
- Relative Price-Performance: Is the substitute cheaper or better?
- Switching Costs: How difficult is it for a user to adopt the substitute?
- Trend Adoption: Is the substitute gaining market share?
- Perceived Value: Do customers view the substitute as equivalent?
A common mistake is ignoring substitutes from outside the industry. For example, a video rental store must consider streaming services, not just other rental stores. Broadening your view captures the true competitive landscape.
5. Rivalry Among Existing Competitors ⚔️
This force captures the intensity of competition. High rivalry leads to price wars, advertising battles, and new product introductions. It is often the most visible force.
Factors driving rivalry include:
- Number of Competitors: Are there many players or few?
- Industry Growth: Is the market growing or stagnant?
- Fixed Costs: Are there high overhead costs driving volume?
- Product Differentiation: Are products commoditized or unique?
- Exit Barriers: Is it hard to leave the industry if it fails?
When growth is slow, competition intensifies. Companies fight for market share rather than new customers. Your report should highlight whether the industry is in a growth phase or a maturity phase, as this dictates rivalry levels.
Structuring the Analysis for Maximum Impact 📝
Once you have analyzed each force, you must structure the report logically. A disorganized document loses points regardless of the quality of the research. Use the following structure to guide your writing.
1. Executive Summary
Write this last. It should summarize the findings of each force and the overall conclusion regarding industry attractiveness. Keep it concise. Professors often read this section first.
2. Methodology and Scope
Explain how you defined the industry and what data sources you used. This establishes credibility. Mention any limitations in your data access.
3. The Five Forces Analysis
Present each force in a dedicated section. Use a consistent format for each. Start with a statement of intensity (High, Medium, Low), followed by the evidence.
4. Synthesis and Strategic Implications
This is the most critical section for grading. Do not just list the forces. Explain what they mean for strategy. If rivalry is high and supplier power is high, the industry is unattractive. If you can find a way to mitigate these forces, that is a strategic insight.
Visualizing the Data Effectively 📈
Text-heavy reports are difficult to scan. Visual aids help professors grasp your arguments quickly. Use diagrams and tables to summarize complex relationships.
Consider creating a force diagram. This visual representation shows the direction and strength of each pressure. Arrows pointing inward indicate pressure on profitability. Arrows pointing outward indicate stability.
Below is a table structure you can use to summarize the intensity of each force. This helps organize your thoughts before writing the narrative.
| Force | Intensity | Key Driver | Impact on Profitability |
|---|---|---|---|
| Threat of New Entrants | High | Low Capital Requirements | Reduces |
| Bargaining Power of Suppliers | Medium | High Switching Costs | Neutral |
| Bargaining Power of Buyers | High | Price Sensitivity | Reduces |
| Threat of Substitutes | Low | High Differentiation | Minimal |
| Rivalry Among Competitors | Medium | Slow Market Growth | Moderate |
Ensure your visual aids are labeled clearly. A graph without a title or axis labels is confusing. Use consistent formatting for all tables and charts.
Common Pitfalls That Lower Grades ⚠️
Even well-researched reports can lose points due to common errors. Avoid these mistakes to protect your score.
- Confusing Forces: Do not confuse the threat of substitutes with the threat of new entrants. Substitutes come from different industries; entrants come from the same industry.
- Lack of Evidence: State a force is “high” but provide no data to support it. Every claim needs backing.
- Static Analysis: The market changes. Do not treat the forces as permanent. Discuss trends and future shifts.
- Ignoring the Conclusion: If the industry is unattractive, what should a company do? A strategic report must offer recommendations or insights.
- Generic Language: Avoid vague phrases. Be specific about margins, market shares, and growth rates.
Refining Your Writing for Clarity and Authority ✍️
The tone of your report should be professional and objective. Avoid emotional language. Let the data speak. Use active voice to strengthen your sentences. Passive voice can make the analysis feel distant.
Check your grammar and spelling. Errors in a professional document suggest a lack of attention to detail. Proofread multiple times. Read the text aloud to catch awkward phrasing. Ensure that your transitions between sections are smooth.
Use specific examples to illustrate abstract concepts. If you discuss switching costs, mention a specific scenario where a customer faced a cost to switch. Concrete examples make your analysis memorable.
Final Checklist Before Submission ✅
Before turning in the assignment, run through this checklist to ensure you have met all requirements.
- Did I define the industry scope clearly?
- Did I analyze all five forces?
- Did I support every claim with data?
- Did I explain the strategic implications?
- Are all tables and charts labeled?
- Did I avoid forbidden language and hype?
- Is the formatting consistent?
- Is the word count within the required range?
Conclusion on Strategic Thinking 💡
Writing a Porter’s Five Forces report is about demonstrating that you can think like a strategist. It is not enough to know the definitions. You must apply them to real-world scenarios with precision. The difference between a B grade and an A grade often lies in the depth of the synthesis. Can you connect the forces to show how they interact? Can you identify a strategic opportunity within the constraints?
Focus on the logic of your argument. Ensure that your conclusion follows naturally from your analysis. If the forces indicate high pressure, do not recommend expansion without a clear mitigation strategy. If the forces are weak, explain how to capitalize on the opportunity. This level of strategic reasoning is what separates top performers in business school.
By following this structured approach, you will produce a report that is rigorous, insightful, and aligned with academic expectations. Good luck with your assignment. 🏆