


1. Naming Conventions for Consistency 🏷️
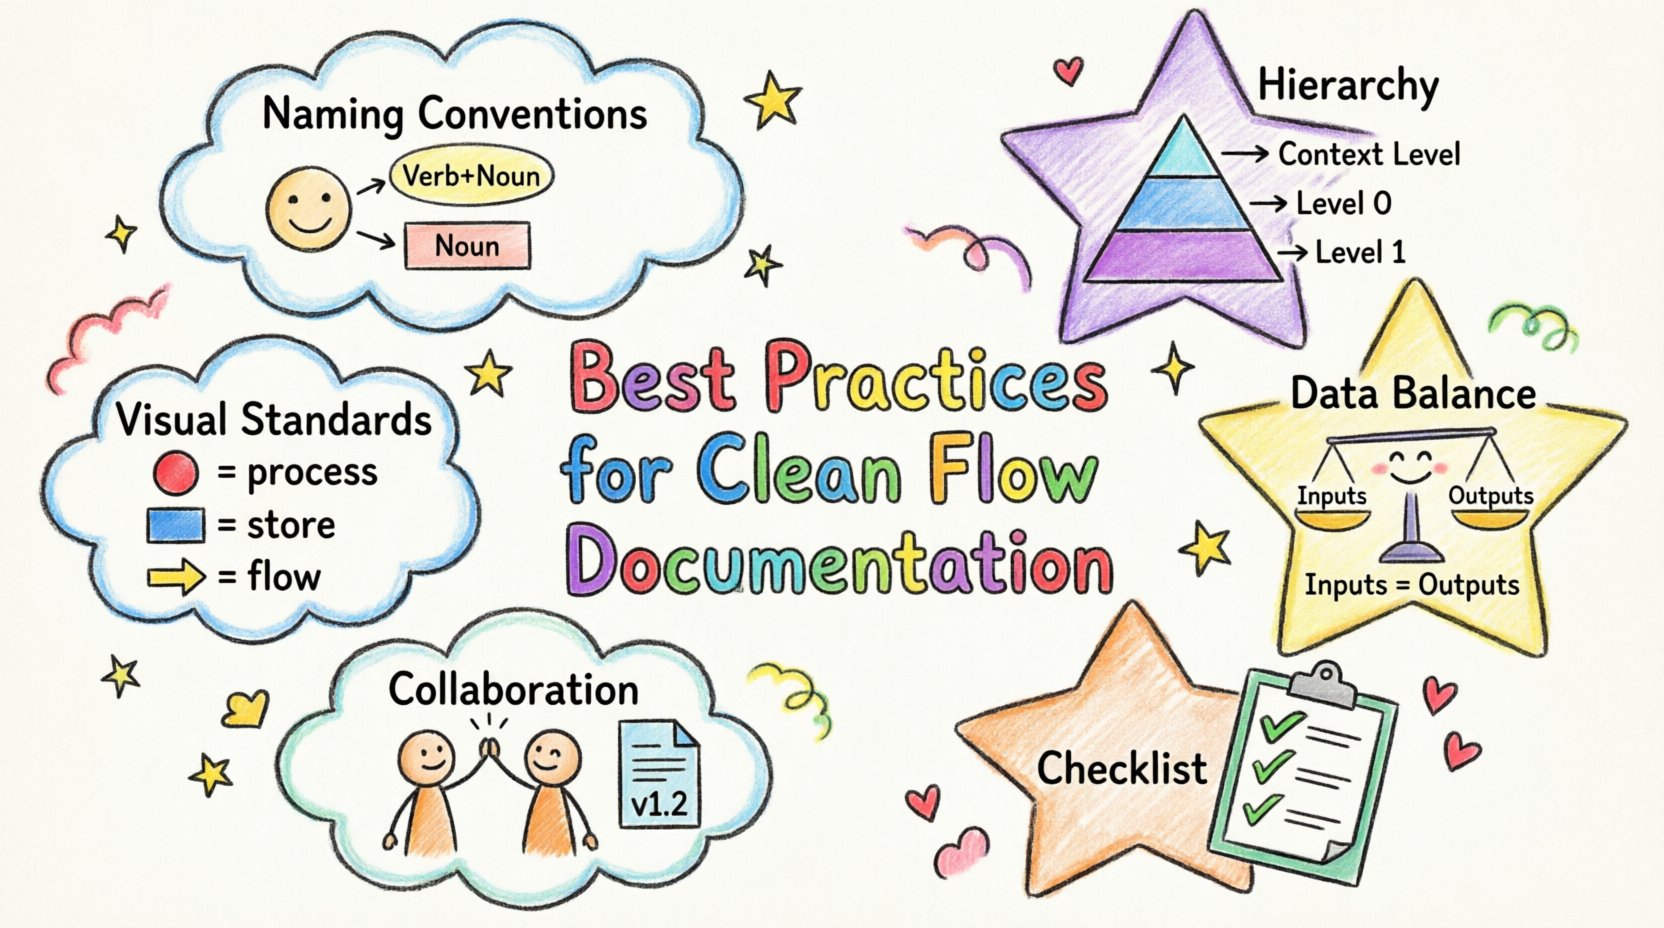
Naming is the foundation of readability. Ambiguous labels force readers to guess the function of a component. Consistent naming conventions allow stakeholders to navigate complex diagrams without constant reference to a legend or external glossary.Process Labels
Processes represent actions or transformations of data. Every process label should follow a Verb-Noun structure. This format immediately communicates what is happening and what data is involved.- Good: Calculate Tax, Validate User, Generate Report
- Bad: Tax, User, Report
Data Store Names
Data stores represent where information rests. These should use Noun phrases only. Avoid verbs in store names, as storage is passive. Use names that reflect the content rather than the operation.- Good: Customer Records, Transaction Log, Inventory Database
- Bad: Save Customer, Store Inventory
External Entity Names
External entities are sources or destinations outside the system boundary. Name them using the specific role or system they represent. Avoid generic terms like “User” unless the system handles multiple distinct types of users that require differentiation.2. Managing Diagram Hierarchy 📚
A single diagram rarely captures the entire complexity of a modern system. Attempting to fit every detail into one view leads to clutter. Hierarchical decomposition allows you to break a system into manageable layers. Each layer provides a different level of granularity.Context Level (Level 0)
The Context Diagram provides the highest-level overview. It shows the entire system as one process and its interactions with external entities. There are no internal processes or data stores shown at this level. It defines the boundary of the system clearly.- One central process representing the whole system.
- All external entities connected directly to this process.
- Only major data flows entering or leaving the system.
Level 0 and Beyond
Level 0 diagrams decompose the central process from the Context Diagram into major sub-processes. This is where data stores and internal flows first appear. As you move to Level 1, Level 2, and so on, you drill deeper into specific sub-processes. Key rule: A data store created at Level 1 must not appear in the Level 0 diagram unless it is explicitly part of the external boundary. Internal storage is hidden until you zoom in. This prevents cognitive overload for the reader.Consistency Across Levels
When decomposing a process, ensure the inputs and outputs match the parent process. If the parent process receives “Order Data”, the child processes must collectively account for that input. Do not introduce new external entities in lower-level diagrams that were not present in the parent level.3. Visual Standards and Geometry 📐
Visual consistency aids quick recognition. Users should be able to identify a data store or a process within milliseconds based on shape and color. Standardizing these elements reduces the cognitive load during diagram review.Shapes and Symbols
While styles vary, the semantics of shapes should remain constant across all diagrams in a project.| Shape | Represents | Label Style |
|---|---|---|
| Circle or Rounded Rectangle | Process | Verb + Noun |
| Open Rectangle or Parallel Lines | Data Store | Noun Phrase |
| Rectangle | External Entity | Noun (Role/System) |
| Arrow | Data Flow | Noun Phrase (Content) |
Line Crossing and Routing
Lines should not cross unnecessarily. Crossing lines create visual noise and make it difficult to trace a specific flow. Use orthogonal routing (90-degree angles) for connections. This creates a grid-like appearance that is easier to scan. If lines must cross, do not merge them. Use an explicit bridge symbol or simply ensure the crossing point does not look like a junction. A junction implies data merging, while a crossing implies no interaction.Arrow Directionality
Every arrow must have a clear head indicating the direction of data movement. Never use lines without heads unless the flow is bidirectional, in which case use two distinct arrows. Consistent arrowheads prevent ambiguity about which way information travels.4. Data Integrity and Balancing ⚖️
A critical aspect of DFDs is ensuring that data is balanced across levels. This means the inputs and outputs of a parent process must match the aggregated inputs and outputs of its child processes.Input/Output Balance
If a Level 0 process receives “Payment Info”, the child processes must show where that information goes. It cannot disappear. If a data flow enters a process, it must either be transformed into a new flow, stored, or leave the system. Data cannot be created or destroyed within a process without being accounted for.Black Holes and Miracles
Avoid creating processes with no inputs (Miracles) or no outputs (Black Holes). A process with no input suggests data is appearing from nowhere. A process with no output suggests data is vanishing. Both violate the conservation of data principle. Every process must transform input into output.Flow Naming
Label every data flow. An arrow without a label is useless. The label should describe the content, not the action. For example, use “Customer ID” instead of “Send ID”. This keeps the diagram focused on data rather than protocol.5. Collaboration and Maintenance 🔄
Documentation is not a one-time task. Systems evolve, and diagrams must evolve with them. A diagram that is accurate today may be obsolete tomorrow if not maintained.Version Control
Track changes to diagrams over time. Include a version number and a date on every diagram. Maintain a change log that explains what was modified and why. This history is vital for debugging issues later or understanding why a specific design decision was made.Review Cycles
Establish a routine for reviewing diagrams with developers and stakeholders. Technical accuracy is as important as visual cleanliness. A diagram can look perfect but contain logical errors. Regular reviews ensure the visual model reflects the actual implementation.Accessibility
Ensure diagrams are accessible to all team members. Avoid using color alone to convey meaning. If you use colors to distinguish between different types of flows, also use labels or line styles. This ensures that diagrams remain readable for those with color vision deficiencies.6. Documentation Checklist ✅
Before publishing a diagram, run through this checklist to ensure quality standards are met.| Criteria | Requirement |
|---|---|
| Process Naming | All processes use Verb-Noun format? |
| Data Store Naming | All stores use Noun phrases? |
| Flow Balance | Inputs/outputs match between parent and child levels? |
| No Orphans | Every entity is connected to at least one process? |
| Label Clarity | Are all data flows labeled with content names? |
| No Crossing Lines | Are unnecessary line crossings avoided? |
| Versioning | Is the version number and date included? |