Modern systems rarely consist of a single monolithic block. They are intricate networks of services, databases, and external dependencies that exchange information continuously. As these systems grow, the cognitive load required to understand them increases exponentially. Engineers, architects, and stakeholders often find themselves navigating a labyrinth where a change in one module ripples unpredictably into another. This is where the discipline of mapping becomes essential. A flow map serves as a visual contract that defines how data moves through the system. It translates abstract logic into a concrete diagram that can be understood across technical and non-technical teams. This article explores how to construct and utilize flow maps to bring clarity to architectural complexity.
Understanding Architectural Complexity 🧩
The primary driver of complexity in software architecture is not the code itself, but the interactions between components. When a system handles high volumes of data, it requires robust mechanisms for ingestion, processing, storage, and retrieval. Each of these stages introduces potential points of failure, latency, and transformation. Without a clear visualization, these interactions become invisible until a problem arises.
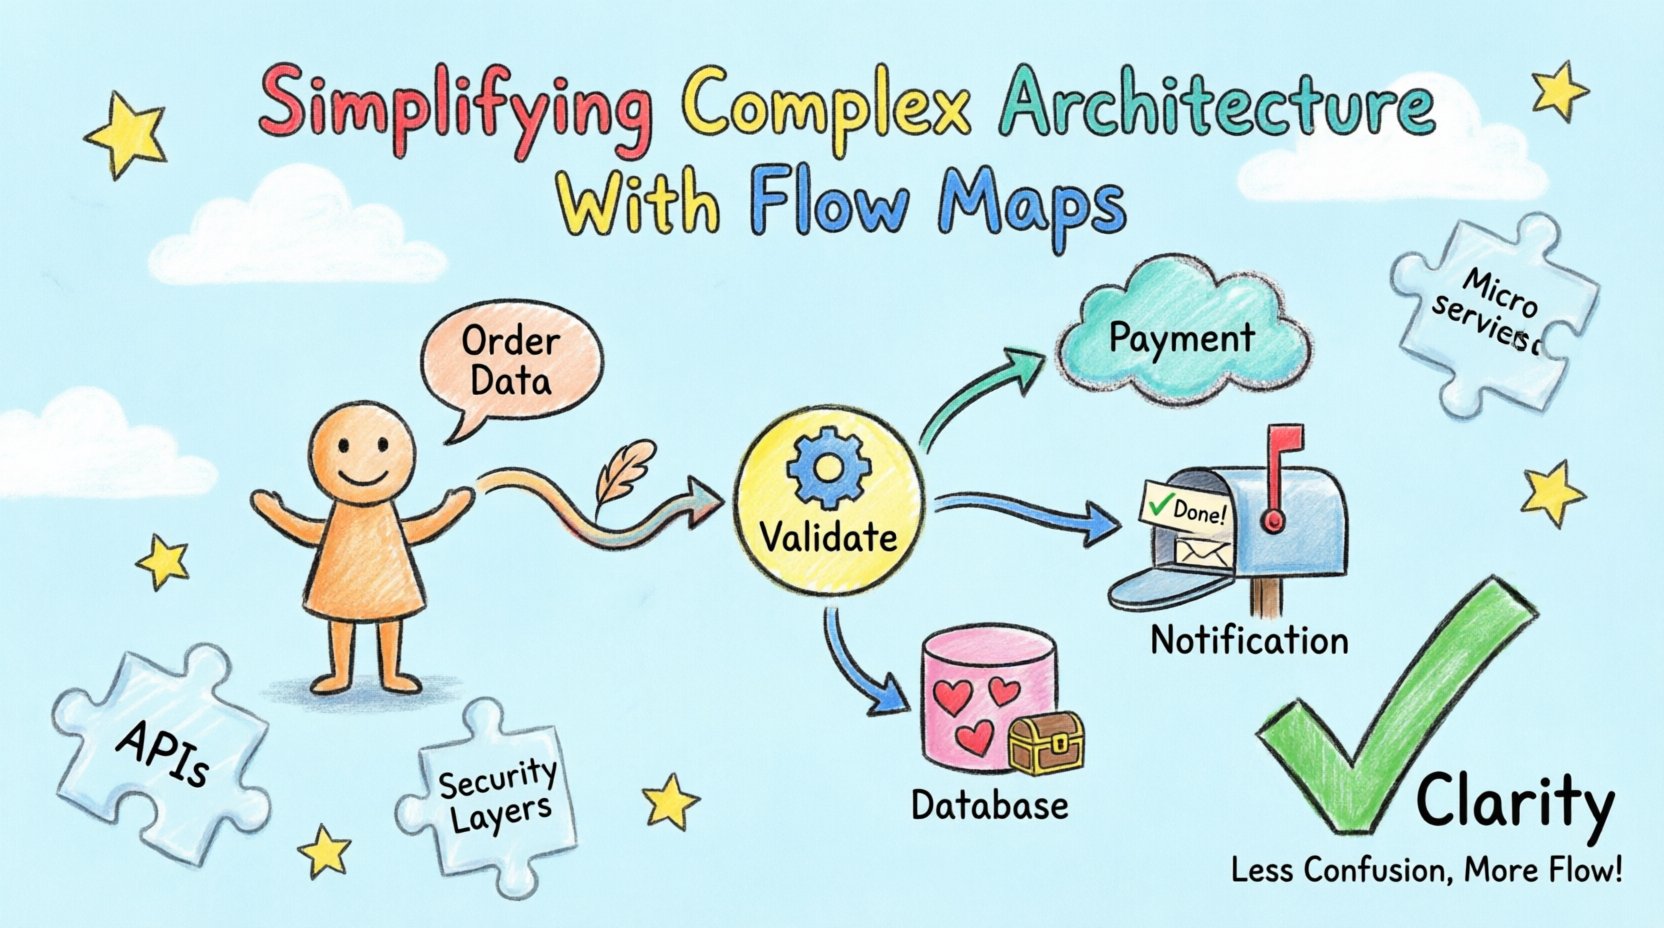
Consider a scenario where a customer order triggers a sequence of events. The order service receives the request, validates the inventory, processes the payment, updates the shipping database, and sends a notification. If these steps are described only in text documentation, the sequence of dependencies is easy to misinterpret. A flow map captures this sequence visually. It highlights where data is created, where it is consumed, and where it is transformed. This visibility reduces the risk of integration errors and helps teams identify bottlenecks before deployment.
The Cost of Hidden Dependencies
Hidden dependencies are the silent killers of system stability. When a component relies on an external service without explicit documentation, the team inherits an unknown risk. Flow maps make these dependencies visible. They force the architect to acknowledge every connection. This accountability ensures that every data path is intentional. If a path cannot be justified on the map, it should be questioned and potentially removed. This process of elimination simplifies the architecture by reducing unnecessary coupling.
Defining the Flow Map 📊
A flow map is a specific type of data flow diagram (DFD) that focuses on the movement of information rather than just the control flow. While control flow diagrams describe the order of operations (if this, then that), flow maps describe the substance of the operation (what data is moving). This distinction is critical for understanding system performance and data integrity.
In a well-constructed flow map, the focus is on the entities involved and the data they exchange. Entities are external sources or destinations of data, such as a user, a third-party API, or a file system. Processes are the actions that transform data. Data stores are where information is persisted. Arrows represent the flow of data between these elements. By adhering to this structure, the map remains consistent and readable regardless of the technology stack involved.
Key Distinctions from Other Diagrams
It is important to distinguish flow maps from other architectural diagrams. Sequence diagrams focus on timing and the order of messages between objects. Entity-relationship diagrams focus on the structure of data within a database. Flow maps sit in the middle, focusing on the lifecycle of data as it traverses the system. They do not necessarily show the internal logic of a function, but rather how data enters and leaves a system boundary.
| Diagram Type |
Primary Focus |
Best Used For |
| Flow Map |
Data Movement |
System Integration & Data Lifecycle |
| Sequence Diagram |
Timing & Interaction |
API Calls & Message Flow |
| Entity-Relationship |
Data Structure |
Database Schema Design |
| System Context Diagram |
External Boundaries |
High-Level Scope Definition |
The Anatomy of a Flow Map 🏗️
Creating a clear flow map requires a consistent vocabulary. If terms are used inconsistently, the diagram becomes ambiguous. The following components form the backbone of an effective map:
- External Entities: These are the actors outside the system boundary. They initiate the flow or receive the final output. Examples include a Client Application, a Payment Gateway, or a Legacy Mainframe.
- Processes: These are the functions that process the data. They are often represented as circles or rounded rectangles. A process takes input, performs a transformation, and produces output. It is crucial to name processes clearly, such as “Validate User” rather than “Process 1”.
- Data Stores: These represent persistent storage. They can be databases, file systems, or message queues. Labels should indicate the type of data stored, such as “User Profiles DB” or “Transaction Logs”.
- Data Flows: These are the arrows connecting the components. They must be labeled with the specific data being transmitted. A label like “Data” is insufficient; “Customer Order Details” is precise.
Design Principles for Clarity 🎨
Clarity is the primary goal of a flow map. If the map is confusing, it fails its purpose. Several design principles help maintain this clarity.
Abstraction and Layering
One of the most common errors is trying to show everything in a single diagram. A system with hundreds of microservices cannot be represented on one page without becoming a mess of intersecting lines. Instead, use layering. Create a high-level map that shows the major subsystems. Then, create detailed maps for each subsystem. This approach allows stakeholders to understand the big picture without getting lost in the details. When a team needs to debug a specific issue, they zoom into the relevant layer.
Consistent Labeling
Labels should follow a standard format. Use noun phrases for data flows and verb phrases for processes. This grammatical consistency helps the reader distinguish between the action and the payload. For example, “Submit Form” (Process) leads to “Form Data” (Data Flow). Consistency reduces cognitive load. When every arrow follows the same naming convention, the eye can scan the map faster.
Directionality
Arrows should always point in the direction of data flow. This seems obvious, but in complex systems, bidirectional flows are common. It is better to use two distinct arrows for read and write operations than a single double-headed arrow. This distinction clarifies the intent of the interaction. If a service reads from a database, the arrow points to the database. If it writes, the arrow points away. This precision helps in identifying potential race conditions or synchronization issues.
Construction Workflow 🛠️
Building a flow map is not a one-time event. It is a process that requires collaboration and iteration. The following steps outline a reliable approach to creating these diagrams.
- Inventory the System: Before drawing, list all known components. Identify the external interfaces, the internal services, and the storage mechanisms. This list serves as the checklist for the map.
- Define the Scope: Decide what the map covers. Does it cover the entire platform or just the checkout module? A focused scope yields a clearer map. Start with the user journey. Trace the path from the initial action to the final result.
- Draft the High-Level View: Sketch the major blocks first. Place the external entities on the edges and the core processes in the center. Do not worry about details yet. Focus on the connections between major blocks.
- Fill in the Data Flows: Label every connection. Specify what data is moving. If a connection carries multiple types of data, split them into separate flows or group them logically. Avoid vague labels.
- Review and Validate: Walk the map with a developer or domain expert. Ask if the path matches the actual code or behavior. Ask where the data comes from and where it goes. This validation step is critical for accuracy.
- Refine and Layer: Once the high-level map is approved, expand specific areas into detailed diagrams. Ensure that the high-level map remains the reference point for the lower levels.
Maintenance and Evolution 🔄
Software changes. Requirements evolve, and features are added. A flow map that is accurate today may be obsolete tomorrow. Treating the map as a static artifact is a mistake. It must be maintained alongside the codebase.
Version Control
Just as source code is versioned, flow maps should be. Store diagrams in a repository where changes are tracked. This history allows the team to see how the architecture evolved over time. It also provides a fallback if a change introduces errors that require a rollback. Versioning ensures that the documentation matches the deployed system.
Integration with CI/CD
In modern development, documentation can be part of the pipeline. If a change alters the data flow, the build should require an update to the map. This practice forces the team to acknowledge the impact of their code. It prevents the documentation from drifting away from reality. Automation can help by checking for orphaned components or missing labels.
Strategic Value of Mapping 🚀
Beyond technical accuracy, flow maps provide significant strategic value. They serve as a communication tool that bridges the gap between technical and business stakeholders.
Facilitating Onboarding
New team members often struggle to understand the system. Reading code is time-consuming and error-prone. A flow map provides a quick overview of how the pieces fit together. It reduces the ramp-up time for new engineers. They can see the data paths without reading every line of code. This accelerates productivity and reduces the burden on senior staff.
Supporting Incident Response
When a system fails, time is critical. Engineers need to know where to look. A flow map highlights the critical paths. If a service is down, the map shows which other services depend on it. This helps in impact analysis. Teams can quickly determine if a failure is isolated or if it will cascade. This clarity speeds up the resolution process.
Identifying Redundancy
Over time, systems accumulate redundant processes. Two services might perform the same validation. A flow map reveals these overlaps. By visualizing the data, architects can see where duplication occurs. Eliminating redundancy reduces costs and improves performance. It simplifies the architecture by removing unnecessary steps.
Common Challenges and Solutions ⚠️
Creating flow maps is not without its difficulties. Teams often face specific challenges that can hinder progress.
- Over-Engineering: Trying to map every micro-interaction leads to a diagram that is too complex. Solution: Stick to the macro view. Group low-level details into single processes.
- Dynamic Data: Some data flows are conditional or dynamic. They change based on user input. Solution: Use separate maps for different scenarios. Do not clutter a single diagram with every possible condition.
- Ownership: Who is responsible for updating the map? Solution: Assign ownership to the architectural team or a designated documentation lead. Make updates part of the definition of done for features.
- Tooling: Choosing the right tool matters. Solution: Select a tool that supports versioning and collaboration. Avoid tools that lock data into proprietary formats.
Conclusion 🌟
Complexity is an inherent part of modern software architecture. It cannot be eliminated entirely, but it can be managed. Flow maps offer a structured way to manage this complexity. They transform abstract interactions into visual representations that are easier to understand, discuss, and maintain. By adhering to clear design principles and maintaining the maps over time, teams can ensure that their documentation remains a valuable asset rather than a burden.
The effort required to create these maps pays off in reduced errors, faster onboarding, and clearer communication. It is a practice that prioritizes clarity and precision. As systems continue to grow, the need for such visualization will only increase. Investing in flow maps is an investment in the long-term health of the software product.