Every complex system begins as a collection of ideas, needs, and constraints. These are the requirements. However, requirements written in natural language are often ambiguous, prone to misinterpretation, and difficult to validate technically. To bridge the gap between what stakeholders want and what engineers build, we need a visual language. This is where Data Flow Diagrams (DFDs) become indispensable. 🧭
A Data Flow Diagram is not just a drawing; it is a logical model that maps how information moves through a system. It strips away physical implementation details to focus on the flow of data itself. This article explores the rigorous process of transforming raw requirements into a structured, validated data flow model.
Understanding the Foundation: Requirements Analysis 📝
Before drawing a single arrow, one must fully understand the input. Requirements analysis is the groundwork upon which the model stands. Without a solid foundation, the structure above will be unstable.
Functional vs. Non-Functional Needs
DFDs primarily model
functional behavior. They answer the question: “What does the system do with the data?” Non-functional requirements (like performance, security, or latency) influence the physical design but do not typically appear as nodes in a DFD. However, they dictate the constraints within which the data flows.
- Functional Requirements: Specific behaviors or functions the system must perform (e.g., “The system must calculate the tax based on the region.”).
- Non-Functional Requirements: Quality attributes (e.g., “The calculation must complete within 2 seconds.”).
Gathering the Input
Information for the model comes from various sources. Interviews, user stories, and existing documentation provide the raw material. The goal is to identify every entity that interacts with the system and every piece of data that enters or leaves it.
When gathering this information, look for verbs. Verbs often indicate processes. Nouns often indicate data objects or entities. This linguistic cue helps in the initial scoping of the diagram.
Core Concepts of Data Flow Diagrams 🗺️
To build a valid model, you must adhere to a standard notation. While notations vary slightly, the core concepts remain consistent. There are four primary components that make up a Data Flow Diagram.
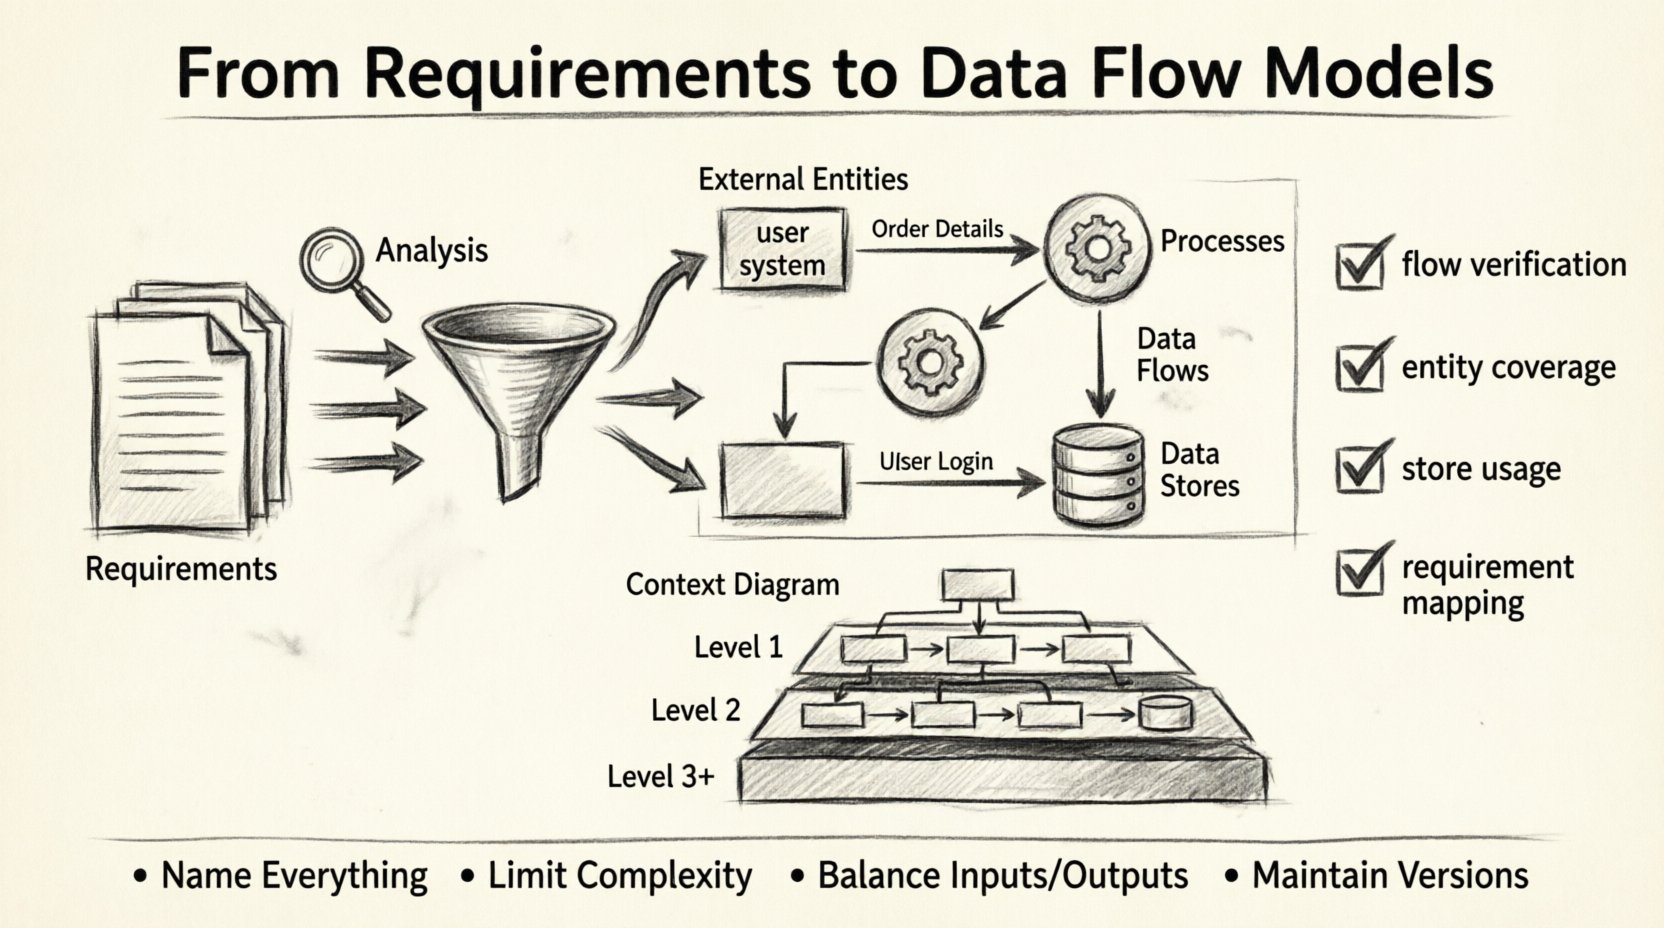
1. External Entities (The Actors)
These are sources or destinations of data outside the system boundary. They could be people, other systems, or organizations. In a DFD, they are usually represented as rectangles.
2. Processes (The Transformations)
Processes transform input data into output data. They are the active elements of the system. In a DFD, they are typically circles or rounded rectangles. A process must have at least one input and one output.
3. Data Flows (The Movement)
These are the arrows that show the direction of data movement. They connect entities, processes, and data stores. Every flow must have a label describing what information is moving (e.g., “Order Details”).
4. Data Stores (The Memory)
These represent places where data is held for later use. They are passive repositories. In a DFD, they are often depicted as open-ended rectangles or parallel lines. A data store does not trigger action; it waits to be read from or written to.
The Translation Process: From Words to Lines 🛠️
Turning text into a diagram requires a systematic approach. This process involves decomposition and abstraction. You do not draw the entire system at once. You start high and drill down.
Step 1: Define the System Boundary
Decide what is inside the system and what is outside. Everything inside is a process, store, or flow. Everything outside is an external entity. This boundary is critical for defining context.
Step 2: Identify the Context
Create a
Context Diagram (also known as a Level 0 DFD). This is the highest level of abstraction. It shows the entire system as a single process and its interaction with external entities.
- Process: The whole system name.
- Entities: All external sources and sinks.
- Flows: Major data inputs and outputs.
Step 3: Decompose the Process
Once the context is established, break the single process into major sub-processes. This is the
Level 1 DFD. Each sub-process should handle a distinct function derived from the requirements. Ensure that data entering the top level also enters one of the sub-processes.
Step 4: Add Detail and Stores
As you drill down to
Level 2 and beyond, you introduce data stores. This is where the logic becomes specific. You define where data rests between steps. Ensure that every data store is connected to at least one process (you cannot just create a storage location without a way to update or retrieve it).
Levels of Abstraction Explained 📊
DFDs are hierarchical. This allows stakeholders to view the system at a level appropriate for their understanding. The following table outlines the differences between the standard levels.
| Level |
Scope |
Primary Focus |
Typical Audience |
| Context Diagram |
System as a whole |
Major inputs and outputs |
Stakeholders, Management |
| Level 1 |
Major functions |
Key processes and data stores |
Project Managers, Architects |
| Level 2 |
Sub-processes |
Specific data transformations |
Developers, Analysts |
| Level 3+ |
Atomic processes |
Detailed logic flow |
Engineers |
Notice that the complexity increases as the level number goes up. The Context Diagram provides a bird’s-eye view, while deeper levels provide the detailed mechanics.
Ensuring Consistency and Balance ⚖️
One of the most critical rules in DFD modeling is
balancing. When you decompose a process, the inputs and outputs of the parent process must match the inputs and outputs of the child processes combined. You cannot create or destroy data out of thin air.
If a Level 1 process takes “User Login” as input, one of its child processes must eventually accept “User Login” or a derived version of it. If a process outputs “Report,” that output must appear in the parent diagram as well. This ensures logical integrity across the hierarchy.
Validation Techniques
How do you know the model is correct? Validation involves several checks:
- Flow Verification: Trace every arrow from source to destination. Does it make sense? Is there a process to handle it?
- Entity Coverage: Are all external entities represented in the context diagram?
- Store Usage: Is every data store accessed? Unconnected stores are often dead code.
- Requirement Mapping: Can you trace every requirement back to a process or flow in the diagram?
Challenges in Modeling Data Flows ⚠️
Creating these models is not always straightforward. Analysts often encounter obstacles that can stall progress or lead to inaccurate representations.
Ambiguity in Requirements
If the initial requirements are vague, the diagram will be too. For example, “Process Order” is too broad. Does it mean “Receive Order,” “Verify Stock,” or “Ship Goods”? These are three distinct processes that require separate nodes. Refining the verb definitions is essential.
Scope Creep
During the modeling phase, new requirements often emerge. It is tempting to add them immediately. However, adding too many details too early can clutter the diagram. It is better to capture new requirements in a backlog and address them in the next iteration of the model.
Confusion with Control Flow
A common error is mixing control logic with data flow. DFDs show
what data moves, not
when it moves. Control flow diagrams (like flowcharts) show logic branches (if/else). DFDs assume the process happens; they just show the data passing through. Keep the focus on the data payload, not the decision logic.
Maintaining the Model Over Time 🔄
Requirements change. Systems evolve. A DFD is not a static artifact to be drawn once and filed away. It must be maintained as a living document.
When a requirement changes, trace the impact. If a new data field is added, does it change the flow? Does it require a new store? Update the diagram immediately. This keeps the documentation aligned with reality.
Version control is also necessary. As the model grows, older versions become relevant for auditing or understanding legacy logic. Labeling versions (e.g., DFD_v1.0, DFD_v2.0) helps track the evolution of the system design.
Best Practices for Clarity ✨
To ensure the model serves its purpose, follow these guidelines for effective communication.
- Name Everything: Entities, processes, and flows must have clear, descriptive names. Avoid abbreviations unless they are industry standard.
- Limit Complexity: If a single process has more than seven inputs or outputs, it is likely too complex. Decompose it further.
- Minimize Crossing Lines: While not always possible, try to arrange the diagram so arrows do not cross excessively. It improves readability.
- Use Consistent Symbols: Stick to one notation style (e.g., Gane & Sarson or Yourdon & DeMarco) throughout the document.
Conclusion on System Design 🏁
The journey from requirements to a data flow model is a discipline of clarity. It requires stripping away the noise of implementation to see the core movement of information. By adhering to the principles of decomposition, balancing, and validation, you create a blueprint that engineers can trust and stakeholders can understand.
This model becomes the reference point for database design, API definitions, and interface specifications. It anchors the project in reality. When the requirements are solid, the diagram is the map that guides the team to the destination. Keep the focus on the data, respect the boundaries, and ensure every arrow tells a story.