Now Reading: The AI Revolution in Infographic Design: From Pixel-Pushing to Automated Storytelling
-
01
The AI Revolution in Infographic Design: From Pixel-Pushing to Automated Storytelling


The AI Revolution in Infographic Design: From Pixel-Pushing to Automated Storytelling
The Shift from Manual Design to High-Level Ideation
The integration of Artificial Intelligence into infographic design represents a fundamental shift in the creative process. Historically, designers were tasked with manual “pixel-pushing,” a time-consuming process involving the meticulous placement of vectors, text boxes, and icons. Today, AI technology has transitioned this workflow toward high-level idea generation. This comprehensive guide explores the potentials of AI-powered infographics, the specific technical problems they solve, and the trajectory of this evolving technology.

The Potentials of AI-Powered Infographics
The primary potential of AI in visual communication is the democratization of professional design. Traditionally, creating high-quality infographics presented two significant barriers: the intimidation of the “blank page syndrome” and the technical skill required to execute a vision. AI transforms this landscape through three key mechanisms.
Eliminating Manual Research
One of the most significant bottlenecks in infographic creation is the research phase. AI tools are now capable of researching complex topics—such as “Steps in the Solar Energy Process”—and generating relevant titles, technical descriptions, and structured data points in seconds. This allows users to move immediately to the visualization phase without spending hours aggregating data.
Enabling Accessibility
AI empowers individuals without formal graphic design training to create stories that are both professional and shareable. By automating the application of design principles such as hierarchy, balance, and color theory, AI ensures that the output is “visually stunning” regardless of the user’s artistic background.
Massive Efficiency Gains
Tasks that traditionally required hours or days in complex vector software like Adobe Illustrator are now reduced to minutes. This efficiency allows for rapid prototyping and faster turnaround times for marketing materials, educational content, and business reports.
Solving the Rigidity of Traditional Templates
Vendors are prioritizing AI-driven tools because traditional template-based methods contain inherent “traps” that frustrate users. While legacy templates offer a starting point, they suffer from significant limitations regarding flexibility.
The table below outlines the core differences between Traditional Templates and AI-Dynamic Layouts:
| Feature | Traditional Static Templates | AI-Powered Dynamic Tools |
|---|---|---|
| Item Count | Locked to predefined numbers (e.g., exactly 4 steps). | Adjustable via sliders (e.g., changing 4 to 6 steps instantly). |
| Layout Integrity | Manual additions often break the layout, causing overlapping or uneven spacing. | AI automatically recalculates spacing to prevent gaps or overlaps. |
| Editing Time | Minor edits can trigger hours of “redesign” work to restore visual balance. | Layout math is handled automatically, requiring zero manual tweaking. |
The “Magic” of AI Integration: Dynamic Synergy
The true power of AI in infographic design lies in the dynamic synergy between user intent and automated execution. This is not merely about choosing a color palette; it is about intelligent structural manipulation. In advanced tools like the Visual Paradigm AI Infographic Generator, this “magic” is exemplified by specific technical capabilities.
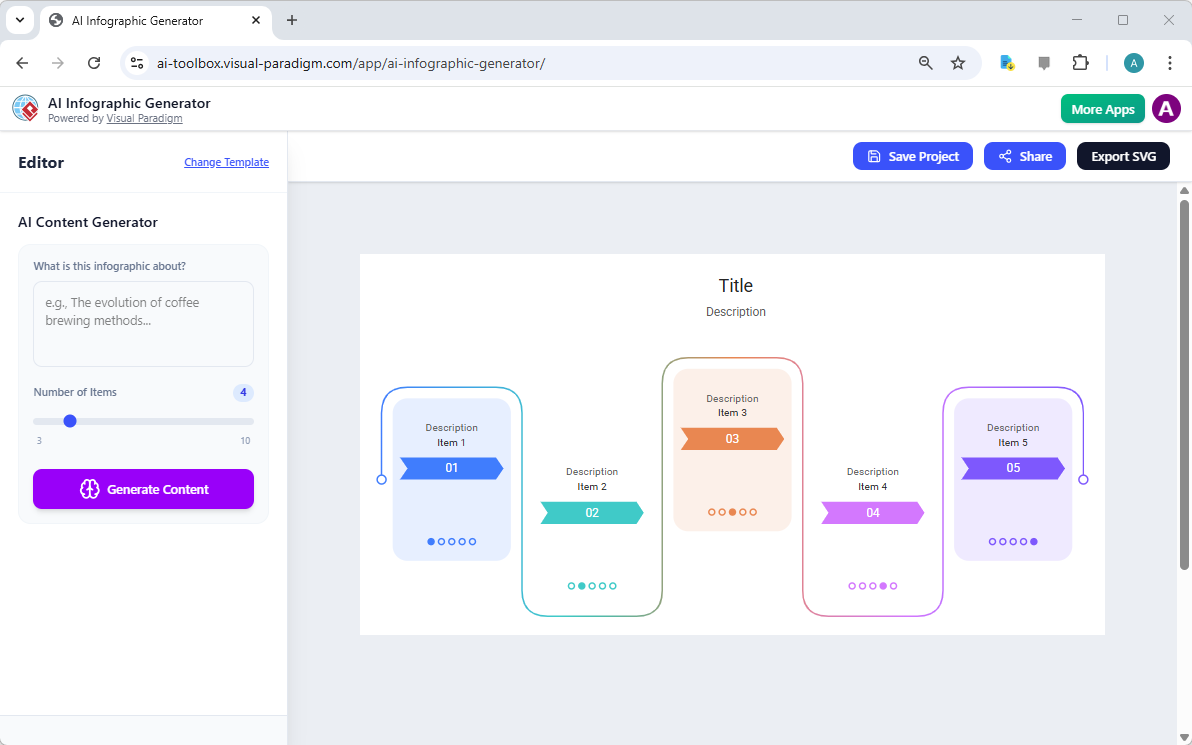
1. Dynamic Item Handling
This feature represents a “game-changer” for layout flexibility. In a traditional workflow, adding a fifth point to a four-point list requires manually resizing and moving every existing element. With AI, users utilize a “Number of Items” slider to specify their exact requirements. The AI engine automatically adjusts the layout logic to accommodate the new count, ensuring perfect alignment without user intervention.
2. Auto-Rendering Logic
Instead of manually dragging and dropping icons or resizing text boxes, the AI analyzes the user’s prompt and the selected item count to auto-render a complete visual story. This logic matches the content with the template’s style, handling the “heavy lifting” of content organization and spatial arrangement.
The Future Direction: Scalability and Intelligence
According to industry sources, the future of infographic design is moving toward evolving content and seamless scalability. The focus is shifting from static image generation to intelligent, adaptable systems.
- Content Flexibility: The trend is moving toward tools that handle data changes dynamically. Users will be able to update statistics or add new steps without necessitating a total redesign of the graphic.
- High-Quality Output: There is a growing demand for professional-grade exports. AI generators are increasingly supporting scalable SVG files, ensuring that designs remain crisp and clear whether used in web publishing or high-resolution printing.
- Intelligence and Speed: The trajectory suggests a move toward deeper research capabilities, where AI not only structures the story but ensures accuracy and relevance, creating high-impact visuals for education and marketing.
While current tools focus on content generation and layout, the broader industry is likely to eventually move toward real-time data integration, further bridging the gap between raw data and visual storytelling.
-
AI-Powered Visual Modeling and Design Solutions by Visual Paradigm: AI-driven tools for visual modeling, diagramming, and software design that accelerate development workflows.
-
Visual Paradigm – All-in-One Visual Development Platform: A unified platform for visual modeling, software and business process design, and AI-powered development tools.
-
AI Chatbot Feature – Intelligent Assistance for Visual Paradigm Users: AI-powered chatbot that delivers instant guidance, automates tasks, and boosts productivity in Visual Paradigm.
-
Visual Paradigm Chat – AI-Powered Interactive Design Assistant: An interactive AI interface for generating diagrams, writing code, and solving design challenges in real time.
-
AI Textual Analysis – Transform Text into Visual Models Automatically: AI analyzes text documents to automatically generate UML, BPMN, and ERD diagrams for faster modeling and documentation.
-
Visual Paradigm AI Chatbot Enhances Multi-Language Support …: AI chatbot supports multiple languages, enabling seamless diagram generation in Spanish, French, Chinese, and more.