


Introduction
In the landscape of modern product management and UX design, understanding the end-user is not merely an advantage; it is a necessity. The Empathy Map Canvas stands as a critical framework within this domain, allowing teams to move beyond demographic data points and step into the emotional and psychological reality of their customers. This guide explores the strategic application of the Empathy Map Canvas, reinforced by the advanced capabilities of Visual Paradigm Online’s AI-powered toolkit.
Key Concepts: Understanding the Empathy Map
Before diving into execution, it is essential to define the core components that make the Empathy Map a vital instrument in design thinking and business strategy.
What is an Empathy Map?
An Empathy Map is a collaborative visualization tool used to articulate what a design team knows about a specific user type. It externalizes knowledge about users in order to 1) create a shared understanding of user needs, and 2) aid in decision-making. Unlike a persona, which focuses on who the user is, an empathy map focuses on the user’s sensory and emotional experience.
The Four Quadrants
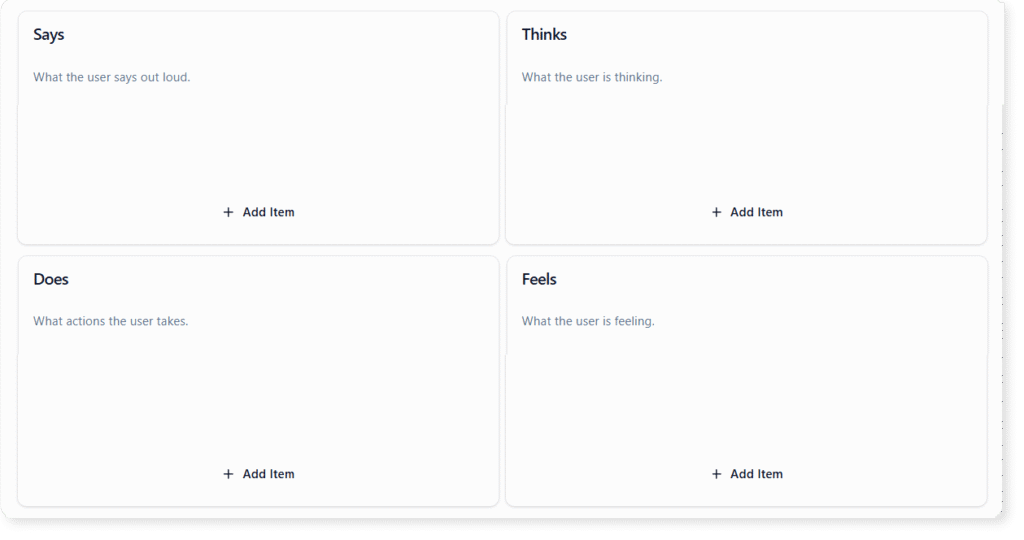
While layouts may vary, the foundational structure of an Empathy Map generally revolves around four key quadrants relative to the user’s experience with a problem or product:
- Says: Direct quotes or significant keywords the user speaks aloud during interviews or usability testing.
- Thinks: The user’s internal monologue. This captures motivations, unvoiced goals, and logic that they might be reluctant to share publicly.
- Does: Observed behaviors and physical actions. This documents how the user interacts with a system or manages a workflow.
- Feels: The emotional state of the user, often represented by adjectives (e.g., frustrated, anxious, delighted) and the root causes of those emotions.
VP AI: Enhancing User Research with Artificial Intelligence
Visual Paradigm (VP) Online has integrated artificial intelligence to transform the traditional, static canvas into a dynamic strategic partner. Here is how VP AI automates and enhances the Empathy Map process:

Instant Canvas Generation
The ‘cold start’ problem is common in brainstorming sessions. VP AI mitigates this via Instant AI Canvas Creation. By simply entering a prompt describing a user scenario—such as ‘A first-time electric car buyer’—the AI generates a fully populated canvas. This provides a structured baseline that teams can refine rather than building from scratch.
Smart Ideation and Context Awareness
When teams hit a creative block, the Smart Ideation Boost feature offers context-aware suggestions for specific sections. If a team is struggling to articulate what a user might ‘Think’ regarding a specific pain point, the AI analyzes the surrounding context of the map and suggests plausible internal thoughts, uncovering opportunities that human researchers might miss.
Strategic Validation and Reporting
Visual Paradigm moves beyond simple mapping by offering AI-Powered Strategic Review. Once an Empathy Map is populated, the AI can generate derived reports, such as a SWOT analysis or Market Readiness check based specifically on the user data in the map. This ensures that the qualitative data from the empathy map directly informs quantitative business strategies.
Guidelines: How to Build an Effective Empathy Map
Creating a valuable Empathy Map requires a structured approach. Follow these step-by-step guidelines to ensure your canvas yields actionable insights.
Step 1: Define the Subject and Goal
Clearly identify who you are mapping and the scope of the scenario. Are you mapping a generic user or a specific persona? Are you analyzing their entire day or just their interaction with a specific feature? Precision here prevents scope creep.
Step 2: Gather Qualitative Research
Empathy Maps should be grounded in data, not assumptions. Aggregate notes from user interviews, survey responses, and observational studies. If using Visual Paradigm, you can import these findings into the canvas notes before sorting them.
Step 3: Populate the Quadrants
Work through the four quadrants (Says, Thinks, Does, Feels). It is often helpful to start with observable traits (Says/Does) before inferring the internal states (Thinks/Feels). Use sticky notes or digital tags to keep items movable.
Step 4: Synthesize and Identify Patterns
Look for contradictions. For example, does the user say they care about security but do utilize weak passwords? These conflicts often reveal the most valuable design opportunities.
Step 5: Validate and Export
Review the map with stakeholders. Visual Paradigm allows for Professional Exports to PDF or Word, making it easy to present findings to executive teams or clients who may not be involved in the drafting process.
Real-World Applications
To better understand the versatility of this tool, consider these scenarios where an Empathy Map drives value:
- Healthcare IT: Mapping ‘A Nurse During a Hectic Shift’ reveals that while the user says they want comprehensive data, they feel overwhelmed, indicating a need for a simplified, high-contrast UI rather than a feature-rich dashboard.
- Fintech: For a ‘Small Business Owner Managing Finances’, the map might highlight that they think accounting is intimidating, suggesting that the software needs to use plain language rather than technical financial jargon.
- User Research: Analyzing a ‘First-Time Electric Car Buyer’ can uncover the specific anxiety regarding range (range anxiety) vs. the environmental pride they feel, guiding marketing messaging to address fears while validating values.
Tips and Tricks for Maximum Impact
Optimize your usage of the Empathy Map Canvas with these practical tips:
- Utilize Focus Mode: In Visual Paradigm Online, switch to Focus Mode to view one section at a time. This reduces cognitive load during brainstorming sessions and prevents the team from jumping around the canvas haphazardly.
- Color Code by User Segment: If you are mapping multiple user types on a single board, use distinct colors for each persona to visualize where experiences overlap or diverge.
- Leverage the Eisenhower Matrix Integration: After identifying user pain points in the ‘Feels’ section, move these items to an Eisenhower Matrix canvas to prioritize which design fixes are urgent and important.
- Don’t Stop at the Map: Use the map as a springboard. Transition directly into a Lean UX Canvas or Customer Journey Map within the same software suite to visualize how the user’s emotional state changes over time.
Resource
-
What Is the Business Model Canvas? Why Use Visual Paradigms & AI Tools: This comprehensive guide explains the Business Model Canvas, its core components, and how visual paradigms and AI-powered tools enhance strategic planning and business innovation.
-
AI-Powered Business Model Canvas Builder – Instant Strategy Design: An AI-driven tool that automates the creation of business model canvases, offering intelligent suggestions and real-time insights to accelerate business planning.
-
AI Canvas Tool – Intelligent Design for Business Frameworks: An AI-powered canvas application that helps users generate and refine business models, value propositions, and strategy frameworks with smart suggestions and automation.
-
AI Business Model Canvas Tool – Smart Strategy Development: A comprehensive AI-enhanced solution for building and refining business models with intelligent insights, real-time feedback, and collaborative features.
-
AI Canvas Editor Release Update: Introduces an AI-powered canvas editor that enhances diagram creation through intelligent suggestions and automated layout optimization.
-
AI-Powered Business Model Canvas Tool Guide: A step-by-step guide on using an AI-enhanced tool to generate and refine business model canvases with intelligent input and real-time recommendations.
-
Mission Model Canvas | AI-Powered Strategy Tool by VP: October 28, 2025 – Coordinate live sessions with your team using the built-in timer and export your final canvas or reports into professional formats such as Word, Markdown, or CSV. … The Mission Model Canvas is specifically designed for non-profits, government agencies, social enterprises, and any organization where the primary goal is mission achievement rather than profit.
-
Comprehensive Tutorial: AI-Powered Business Canvas Toolkit with Visual Paradigm: This page provides a detailed guide on using an AI-enhanced Business Model Canvas toolkit integrated with Visual Paradigm for automated business strategy development.
-
AI Canvas Tool – Visual Paradigm: An AI-driven tool within Visual Paradigm that enables users to generate and refine business canvases through intelligent automation and natural language input.
-
Mastering the Business Model Canvas with AI: Step-by-Step Guide Using Visual Paradigm: This blog post offers a structured walkthrough of leveraging AI capabilities in Visual Paradigm to create, customize, and optimize Business Model Canvases efficiently.
-
How the AI Business Model Canvas Builder Works – Visual Paradigm: This page explains the functionality of the AI-powered Business Model Canvas Builder, highlighting how machine intelligence automates canvas creation and strategic insight generation.
-
Deep Learning AI Canvas | Strategy Tools Analysis Canvas Template: Edit Localized Version: 深度學習 AI 畫布(TW) | 深度学习 AI 画布(CN) View this page in: EN TW CN · Visual Paradigm Online (VP Online) is an online diagram software that supports analysis canvases, various charts, UML, flowchart, rack diagram, org chart, family tree, ERD, floor plan, etc .
-
Product Canvas | AI-Powered Strategy Tool by VP: Build products people love. Combine strategy, design, and feedback into one visual space with our AI-powered Product Canvas to bring ideas to market faster.
-
Lean UX Canvas | AI-Powered Strategy Tool by VP: October 28, 2025 – Create a complete strategy framework in moments. Simply describe your vision, and the AI canvas generator transforms it into a structured, insight-rich canvas that helps you visualize, plan, and refine your next big idea.
-
Lean Canvas – Visual Paradigm: October 28, 2025 – Our application is designed to be your strategic partner, providing intelligent tools to enhance every step of your planning process for the Business Model Canvas. … Have a startup idea? Just enter ‘a mobile app for local home-cooked meal delivery’ and let our AI generate a complete Lean Canvas, outlining the problem, solution, and key metrics.
-