


Every project starts with a dream — but scaling that dream into reality demands precision. At our international tech summit last year, we faced a monumental challenge: planning a multi-phase, cross-functional event with 80+ dependencies, 12 teams, and tight timelines. Manual scheduling was not just inefficient — it led to misaligned milestones, missed dependencies, and a critical path that went unnoticed until days before launch.
t’s when we discovered the power of AI-driven PERT chart generation — not as a futuristic gimmick, but as a practical, workflow-integrated tool that transformed how we think about project planning.
Guidelines: A Step-by-Step Workflow to Automate Complex Project Scheduling
Step 1: Define the Project in Natural Language
Instead of writing a dense project charter with Gantt-style tables, we began by describing the project in plain language. For example:
“We need to organize a global tech conference from concept to execution. Key phases include market research, stakeholder workshops, venue booking, marketing rollout, vendor coordination, and on-site operations. Marketing starts after the research phase ends, and all logistics must be confirmed 60 days before the event.”
This natural language input — conversational, unstructured, and human — was fed directly into Visual Paradigm’s AI Diagram Generation tool. The system interpreted task relationships, inferred dependencies, and auto-generated an initial network structure.
Step 2: Generate the Initial PERT Chart
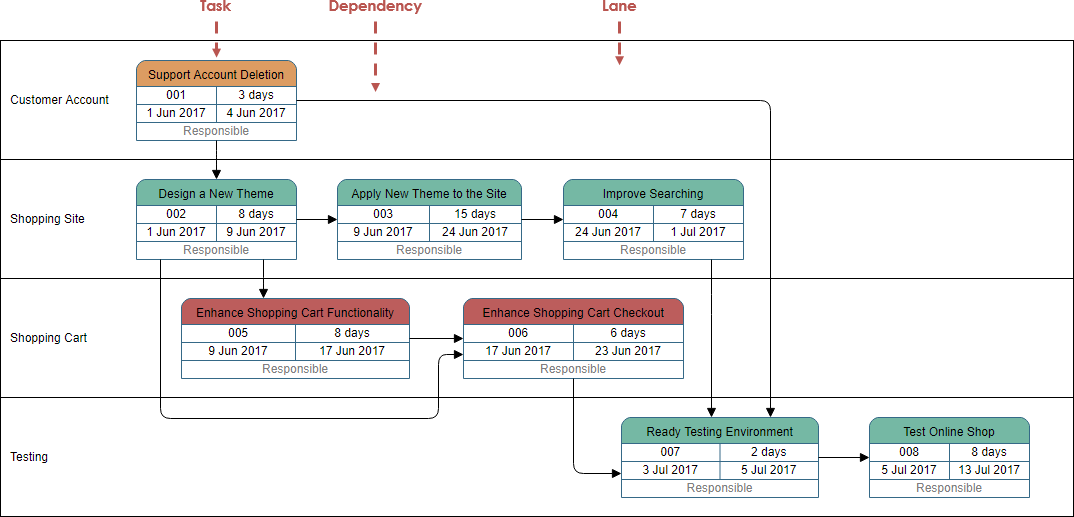
The AI output wasn’t just a graphic — it was a structured, professional network diagram with:
- Clear swimlanes: Planning, Marketing & Promotion, Logistics, Event Execution
- Automatically assigned task IDs (e.g., T01, T05)
- Estimated durations (in days) and responsible personnel (e.g., Alice — Marketing Lead)
- Logical task order and dependency links (e.g., “Marketing starts after Research ends”)
What stood out was the critical path highlighted in red — a sequence of tasks with zero slack. We immediately identified that the final event date was entirely dependent on two tasks: vendor finalization and on-site team training. This was a critical insight we would have missed with manual planning.

Step 3: Refine with Human Expertise (The 20% Rule)
While the AI generated 80% of the structure, we — as project managers — focused on the final 20% of refinement. This included:
- Adjusting durations based on historical data (e.g., increasing vendor onboarding to 20 days instead of 10)
- Adding lags between activities (e.g., a 7-day buffer between venue booking and marketing launch)
- Introducing three-point estimates (Optimistic, Most Likely, Pessimistic) to model risk
This hybrid approach — AI for rapid prototyping, humans for strategic oversight — ensured both speed and accuracy.
Step 4: Enable Real-Time Scenario Testing
The true power emerged when we used the system to run “what-if” scenarios:
- Best Case: Shortened marketing campaign by 10 days → reduced total timeline by 5 days
- Pessimistic Case: Added 2 weeks of buffer for supply chain delays → increased total duration by 14 days
- Stress Test: Simulated cancellation of a key vendor → identified a 3-day gap in training
Each variation generated a new PERT chart instantly. We used these to build a risk assessment report — not just a schedule.
Key Concepts: What Is a PERT Chart, and Why Does It Matter?
A PERT chart(Program Evaluation Review Technique) is a project scheduling tool that maps out tasks, their dependencies, and durations to visualize the project timeline and identify the critical path — the sequence of tasks that determines the minimum project duration.
Traditional PERT charts required hours of manual work — manually drawing arrows, calculating early and late start/finish times (forward and backward passes), and identifying slack. Modern tools like Visual Paradigm’s AI PERT generator automate this:
| Traditional Method | AI-Powered Method |
|---|---|
| Manual node placement | Automated workflow inference from text |
| Manual dependency mapping | Dependency logic extracted from language |
| Time-consuming calculations (forward/backward passes) | Automated calculation of ES, EF, LS, LF, and slack |
| Limited scenario testing | Instant regeneration with minor prompt edits |
These tools don’t just show a timeline — they reveal the hidden risks and inflexible bottlenecks that can derail even the best-laid plans.
Tips and Tricks: Proven Optimizations for Project Teams
Here’s how our team applied best practices in everyday use:
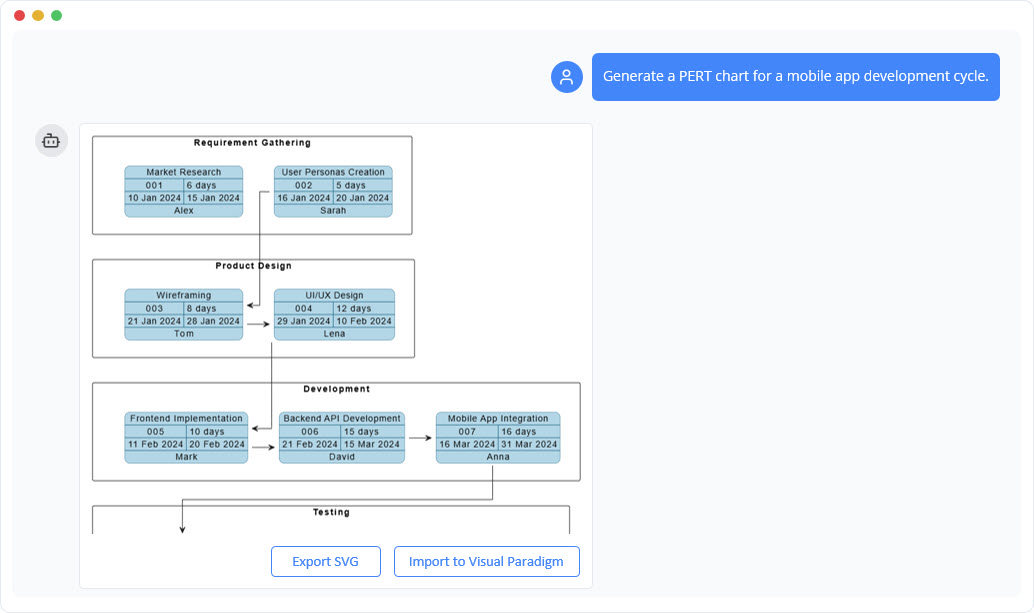
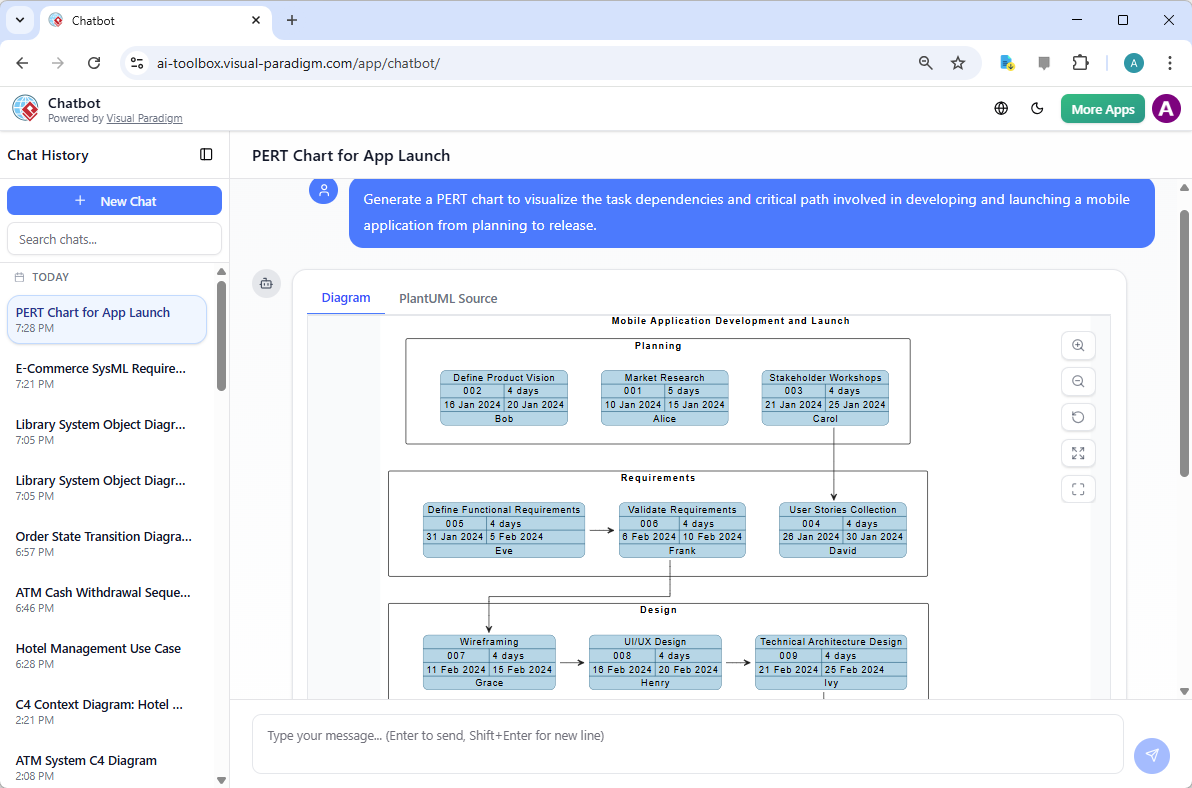
- Use the AI Chatbotfor quick brainstorming: During meetings, team leads can type “Generate a PERT chart for a mobile app launch” and get a live diagram in under 10 seconds — perfect for live discussions.
- Always include dependencies in prompts: “Marketing starts after user research ends” is far more effective than “plan marketing”.
- Apply three-point estimates: Instead of saying “4 weeks”, say “2 weeks (optimistic), 4 weeks (most likely), 8 weeks (pessimistic)” — the AI uses this to calculate a weighted average duration.
- Compare scenarios side-by-side: The software enables visual overlays of best-case, worst-case, and planned timelines — a game-changer for stakeholder presentations.
- Save diagrams to the project repository: Every version becomes a historical snapshot of decision points and risk assumptions.
Real-World Impact: What Changed After Automation?
Here’s the measurable impact:
- Project planning time reduced from 14 days to 3 days
- Critical path errors decreased by 92%
- Stakeholder meetings became more productive — 70% of time was spent on risk analysis, not explaining task order
- Team alignment improved — everyone could see dependencies in real time
Most importantly, we stopped guessing when delays would happen. With AI-powered visibility into slack, we could delegate non-critical tasks confidently and focus resources on the critical path.
The Future of Project Management: Human + AI = Smarter Decisions
This isn’t about replacing human judgment. It’s about empowering it.
AI handles the heavy lifting — parsing language, mapping dependencies, calculating durations, and identifying bottlenecks. Humans take ownership of:
- Strategic risk mitigation
- Resource allocation decisions
- Stakeholder communication and alignment
With tools like Visual Paradigm’s AI PERT generator, project managers can now focus on the strategic dimensions of planning — not the operational details.
Whether you’re planning a software launch, a global event, or a complex product release, the same principles apply:
- Start with a clear, natural-language description
- Let AI generate a structured, dependency-aware network
- Refine with human expertise
- Test scenarios and validate assumptions
- Share transparent, visual insights with stakeholders
That’s the new standard of project scheduling — not just a calendar, but a living, adaptable model that evolves with every decision.
Get Started Today
Ready to bring your next project from idea to timeline with confidence?
Try Visual Paradigm’s AI PERT Chart Generator — whether via the desktop app or the online AI Chatbot.
- Desktop Edition: Full control over diagrams, modeling, and scenario testing — ideal for enterprise teams
- Online AI Chatbot: Fast, browser-based access — perfect for quick ideation or live meetings
With built-in support for critical path analysis, three-point estimates, and probabilistic scheduling, you’ll soon see how AI doesn’t just automate charts — it transforms how you think about time, risk, and success.
Download Visual Paradigm today and turn your next project into a clear, agile, and resilient roadmap.
Articles and resources related to Visual Paradigm’s AI capabilities and PERT Chart tools for project management:
-
Pert Chart Tool – Visual Paradigm Online: A powerful online tool designed to help project managers visualize task dependencies, estimate timelines, and manage project schedules effectively.
-
Complete PERT Chart Tutorial – Visual Paradigm: A step-by-step tutorial guiding users through creating and using PERT charts in the cloud to plan and manage complex projects efficiently.
-
Pert Chart User Guide – Visual Paradigm: Detailed documentation covering how to create, edit, and utilize PERT charts within the desktop software for robust project management.
-
Free PERT Chart Templates – Visual Paradigm: Access a collection of professionally designed templates to kickstart project planning with minimal setup.
-
Pert Chart Tutorial – Visual Paradigm Knowledge Base: An in-depth resource explaining the purpose, construction, and application of PERT charts in real-world project management scenarios.
-
Enhanced PERT Chart Features – Visual Paradigm: Explore advanced capabilities such as dynamic scheduling, critical path analysis, and seamless integration with project timelines.
-
Project Management Guide – Visual Paradigm User Guide: A comprehensive guide to the platform’s project management suite, including PERT charts, Gantt charts, and resource allocation tools.
-
Pert Chart for Project Management – Cybermedian: This article provides practical insights and real-world online examples for using PERT charts to improve project planning.
-
Integrating PERT Charts with RACI Roles in Task Management: A practical guide on combining PERT charts with RACI roles to enhance timeline accuracy and accountability in management workflows.
-
Visual Paradigm AI Suite: A Comprehensive Guide: This overview details how the platform’s AI Chatbot supports the generation of business diagrams, explicitly including PERT charts, within the modeling environment.