In software engineering and system design, logic often begins as abstract thought. How does a system react when a user logs in? What happens when a payment fails? How does a device transition from sleep mode to active processing? These questions define the behavior of complex systems. State diagrams provide a structured way to visualize these behaviors before a single line of code is written. By translating abstract ideas into visual code maps, developers can ensure robustness, clarity, and maintainability.
This guide explores state diagram examples across various complexity levels. We will examine how to define states, transitions, and events, and how these visual representations directly influence code structure. Whether you are designing a simple embedded system or a complex user authentication flow, understanding the mechanics of state machines is essential for reliable software architecture.
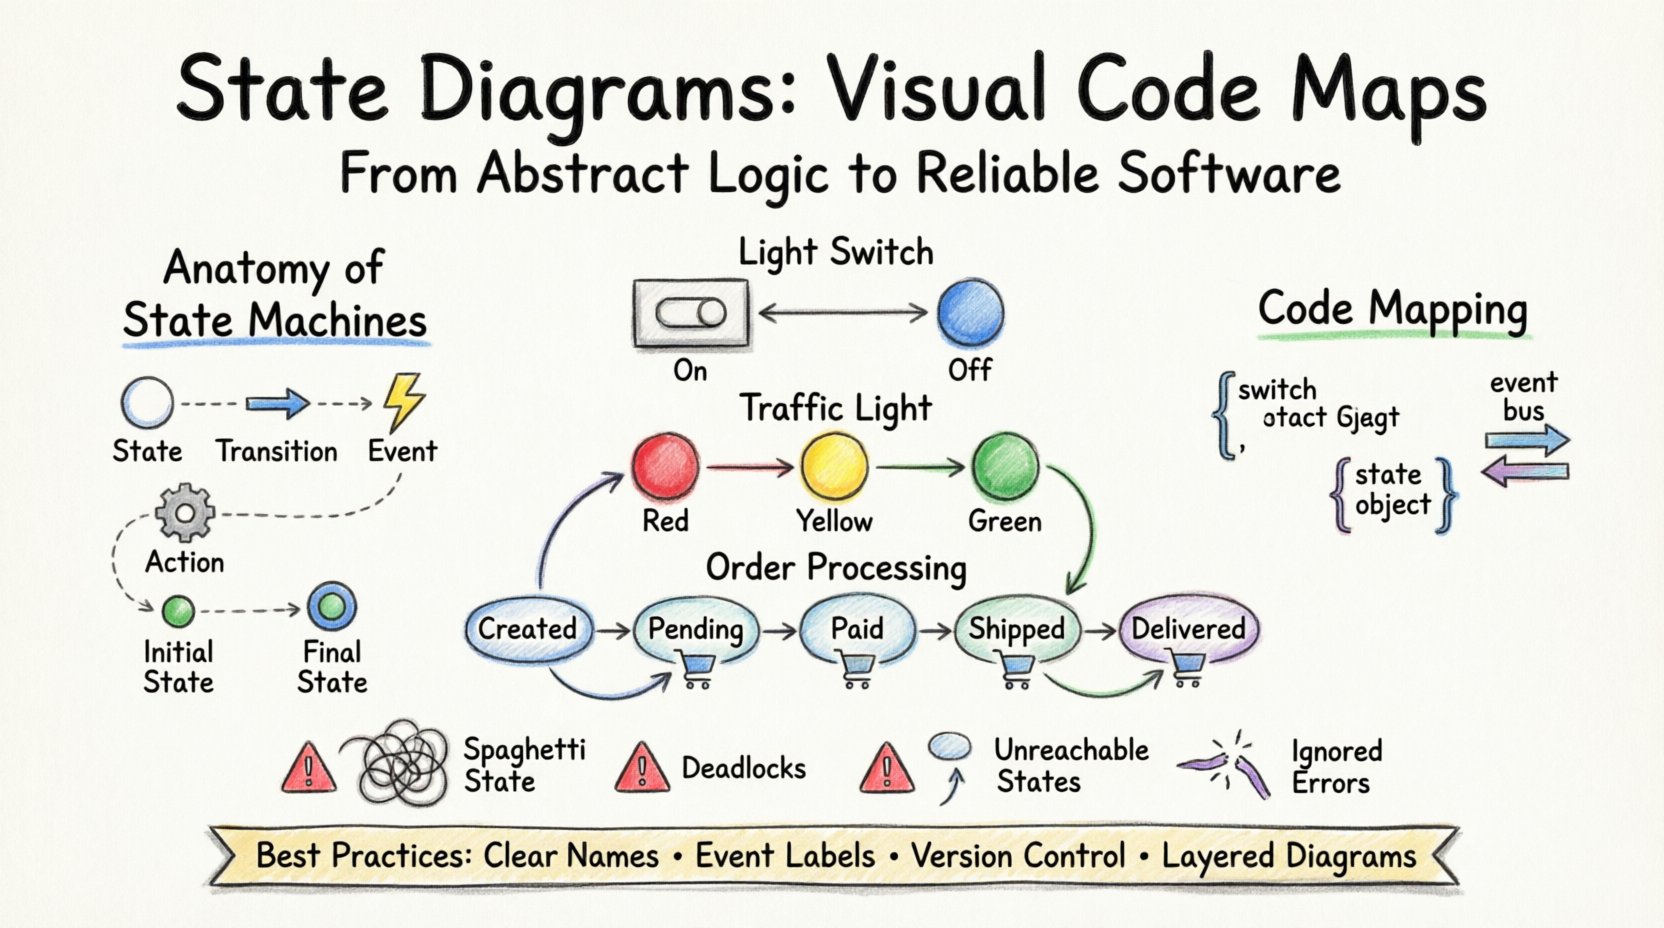
Understanding the Anatomy of a State Machine 🧱
Before diving into examples, it is necessary to define the core components that make up a state diagram. These elements form the vocabulary of your system’s logic.
- State: A condition or situation during the life of an object during which it satisfies some condition, performs some activity, or waits for some event. For example, a user account can be in a Logged In state or a Logged Out state.
- Transition: The movement from one state to another. This is triggered by an event or condition.
- Event: An occurrence of interest that can cause a transition. Examples include User Click, Timeout, or Data Received.
- Action: Activities performed upon entry to, exit from, or during a transition of a state. This might involve logging data, sending a notification, or updating a database.
- Initial State: The starting point of the diagram, usually represented by a filled circle.
- Final State: The termination point, represented by a double-bordered circle.
When mapping these concepts to code, each state often corresponds to a specific block of logic, and transitions correspond to conditional checks or event listeners. Visualizing this relationship prevents logic gaps and ensures that every possible scenario is accounted for.
Basic State Diagram Examples 💡
Starting with simple scenarios helps establish a baseline for understanding how transitions work. These examples illustrate the fundamental flow of control.
1. The Light Switch 🏠
This is the quintessential example of a finite state machine. The system has two primary states: On and Off.
- State A (Off): The light is not emitting photons.
- Event: Switch Toggle.
- Transition: Off → On.
- State B (On): The light is emitting photons.
- Event: Switch Toggle.
- Transition: On → Off.
Code Mapping Logic:
In a programming context, this translates to a boolean variable. If the variable is false and the event occurs, the variable becomes true. If the variable is true and the event occurs, the variable becomes false. The visual diagram makes it immediately obvious that there are no other states, preventing the creation of logic like if (light == 'dimmed') unless explicitly designed.
2. Traffic Light 🚦
A traffic light involves a sequence of states that must follow a specific order. It is a cyclic state machine.
- States: Red, Yellow, Green.
- Transitions:
- Red → Green (after timer expires)
- Green → Yellow (after timer expires)
- Yellow → Red (after timer expires)
Code Mapping Logic:
This structure suggests using a list or array of states with an index pointer. The code increments the index on a timer tick. If the index reaches the end of the list, it loops back to zero. The diagram ensures that a transition from Red to Green is never skipped, maintaining safety logic.
Intermediate Scenarios: Order Processing 🛒
As systems grow, states become more specific. An e-commerce order processing system is a common use case where state diagrams clarify complex workflows.
In this scenario, an order moves through several stages before completion. A state diagram helps identify which actions are valid at each stage.
State Breakdown
- Created: Order is placed but not paid.
- Pending: Payment is processing.
- Paid: Payment is confirmed.
- Shipped: Order is in transit.
- Delivered: Order is received.
- Cancelled: Order is voided.
Transition Rules
| Current State | Event | Next State | Action |
|---|---|---|---|
| Created | Initiate Payment | Pending | Charge Card |
| Pending | Payment Success | Paid | Notify Warehouse |
| Pending | Payment Fail | Created | Refund Attempt |
| Paid | Ship Item | Shipped | Generate Label |
| Shipped | Customer Cancel | Cancelled | Stop Shipment |
Why Visualize This?
Without a diagram, developers might accidentally allow a Cancelled order to be Shipped or allow a Pending payment to be skipped. The diagram enforces the rules of the business logic. It acts as a contract between the business requirements and the technical implementation.
Advanced Logic: Authentication Flows 🔐
Security systems require rigorous state management. Authentication flows often involve nested states or concurrent states to handle sessions, tokens, and permissions.
Session Management States
A robust authentication system handles multiple states simultaneously. For instance, a user can be Logged In but also have a Session Expiring warning active.
- State: Unauthenticated
- Event: Login Attempt
- Transition: To Authenticating
- State: Authenticating
- Event: Credentials Valid
- Transition: To Authenticated
- Event: Credentials Invalid
- Transition: To Locked
- State: Authenticated
- Event: Logout
- Transition: To Unauthenticated
- Event: Token Expiry
- Transition: To Refresh Required
Code Mapping Logic:
In code, this often translates to a state object within the user session. The application checks the current state before allowing actions. For example, if the state is Locked, the login button is disabled until a reset event occurs. The diagram ensures that the Refresh Required state is handled distinct from the Logged Out state, preserving user data during the refresh attempt.
Mapping Diagrams to Code 💻
The ultimate value of a state diagram lies in its ability to guide implementation. When you look at the diagram, you should be able to derive a structure for your code. Here is how the visual elements translate into programming constructs.
1. The Switch Statement Pattern
For simple state machines, a switch or if-else chain based on a state variable is common.
switch (currentState) {
  case 'IDLE':
    handleIdleEvents();
    break;
  case 'RUNNING':
    handleRunningEvents();
    break;
  case 'ERROR':
    handleErrorEvents();
    break;
}
The diagram dictates which cases exist. If the diagram shows a Paused state, the code must have a corresponding case.
2. The State Object Pattern
For more complex systems, each state can be an object with its own methods.
const stateContext = {
  idle: {
    enter: () => { log('System Idle'); },
    handleEvent: (event) => {
      if (event === 'START') return start();
    }
  },
  running: {
    enter: () => { log('System Running'); },
    handleEvent: (event) => {
      if (event === 'STOP') return stop();
    }
  }
};
This approach encapsulates the logic for each state, making the code easier to maintain and test. The diagram serves as the schema for this object structure.
3. Event-Driven Architecture
Modern systems often use an event bus. The diagram defines the valid transitions, while the code listens for events and updates the state machine accordingly.
- Diagram: Shows that Event A moves you from State 1 to State 2.
- Code: Listens for Event A, checks if currentState === State 1, and then updates to State 2.
This separation of concerns allows the state logic to be tested independently of the event sources.
Common Pitfalls ⚠️
Even with a diagram, implementation errors occur. Being aware of common issues helps in debugging and refinement.
1. The Spaghetti State
When transitions become too numerous, the diagram looks like a tangled web. This usually indicates that the state abstraction is too granular.
- Solution: Consolidate states that share the same outgoing transitions and behavior. Use hierarchical states if the sub-states are too complex.
2. Deadlocks
A deadlock occurs when the system enters a state where no transitions are possible, but it is not the final state. The system hangs indefinitely.
- Solution: Review every state in the diagram to ensure there is at least one exit path, or that it is explicitly marked as a terminal state.
3. Unreachable States
Sometimes a state is defined in the diagram but can never be reached from the initial state due to transition constraints.
- Solution: Perform a path analysis. Trace the flow from the start node to every other node to verify connectivity.
4. Ignoring Error States
It is common to diagram the Happy Path (ideal scenario) and forget the Unhappy Path (errors). This leads to runtime crashes.
- Solution: Ensure every transition has a fallback or an error state. The diagram should show where failures are handled.
Best Practices for Documentation 📝
To ensure your state diagrams remain useful over time, adhere to these documentation standards.
- Consistent Naming: Use clear, descriptive names for states. Avoid abbreviations that might confuse new team members.
- Event Descriptions: Label transitions with the specific event name used in the code. This bridges the gap between design and development.
- Version Control: Treat state diagrams as code. Store them in version control and commit them when logic changes.
- Layering: For complex systems, use multiple diagrams. One for high-level flow, another for detailed sub-processes.
Comparison of Diagram Types 📊
Different tools and methodologies offer variations of state diagrams. Understanding the differences helps in selecting the right approach for your project.
| Diagram Type | Focus | Best Used For |
|---|---|---|
| UML State Machine | Object lifecycle | Object-oriented software architecture |
| Finite State Automaton | Input processing | Compiler design, text parsing |
| Statechart | Hierarchy and concurrency | Complex embedded systems, UI workflows |
| Flowchart | General process flow | Simple sequential logic, business processes |
While Flowcharts are common, they often fail to capture the persistent nature of states. State diagrams explicitly track the current condition of the system, making them superior for systems that must remember their history.
Final Thoughts on Logic Mapping 🧠
Creating state diagrams is an investment in the stability of your software. It forces you to think through edge cases and transition rules before implementation begins. By treating the diagram as a visual code map, you reduce the cognitive load on developers who maintain the system later. They can look at the diagram to understand the intended flow without deciphering complex conditional logic.
Whether you are managing a simple device or a distributed cloud service, the principles remain the same. Define your states clearly, map your transitions precisely, and ensure your code reflects the visual truth. This discipline leads to fewer bugs, easier debugging, and systems that behave predictably under pressure.
Start your next project by sketching the state flow. You may find that the complexity of the code reduces significantly when the logic is visualized first.