Understanding how software behaves under different conditions is fundamental to robust engineering. A state diagram provides a clear map of these behaviors. It illustrates the various states a system can occupy and how it moves between them based on specific triggers. This visual tool is essential for defining logic without ambiguity.
Whether you are designing a login sequence, managing a workflow, or controlling hardware, clarity is paramount. This guide breaks down the core concepts. You will learn how to model logic effectively using standard notation. By the end, you will have a solid foundation in state machine diagrams.
🧐 What Exactly Is a State Diagram?
A state diagram is a type of behavioral diagram used in modeling. It describes the distinct states of an object or system over its lifecycle. Instead of showing the flow of data, it focuses on the condition of the entity at any given moment.
Think of a traffic light. It is not just moving from red to green; it is in a specific state. It cannot be both red and green simultaneously. A state diagram captures this exclusivity. It defines:
- What states exist?
- How does the system enter a state?
- What actions occur while in that state?
- What causes the system to leave that state?
This approach is particularly useful for systems with complex conditional logic. It prevents the confusion that often arises from linear flowcharts when dealing with loops or parallel processes.
🔑 Core Components of a State Machine
To build a valid diagram, you must understand the vocabulary. Every state diagram relies on a set of fundamental building blocks. Without these, the model loses its meaning.
1. States
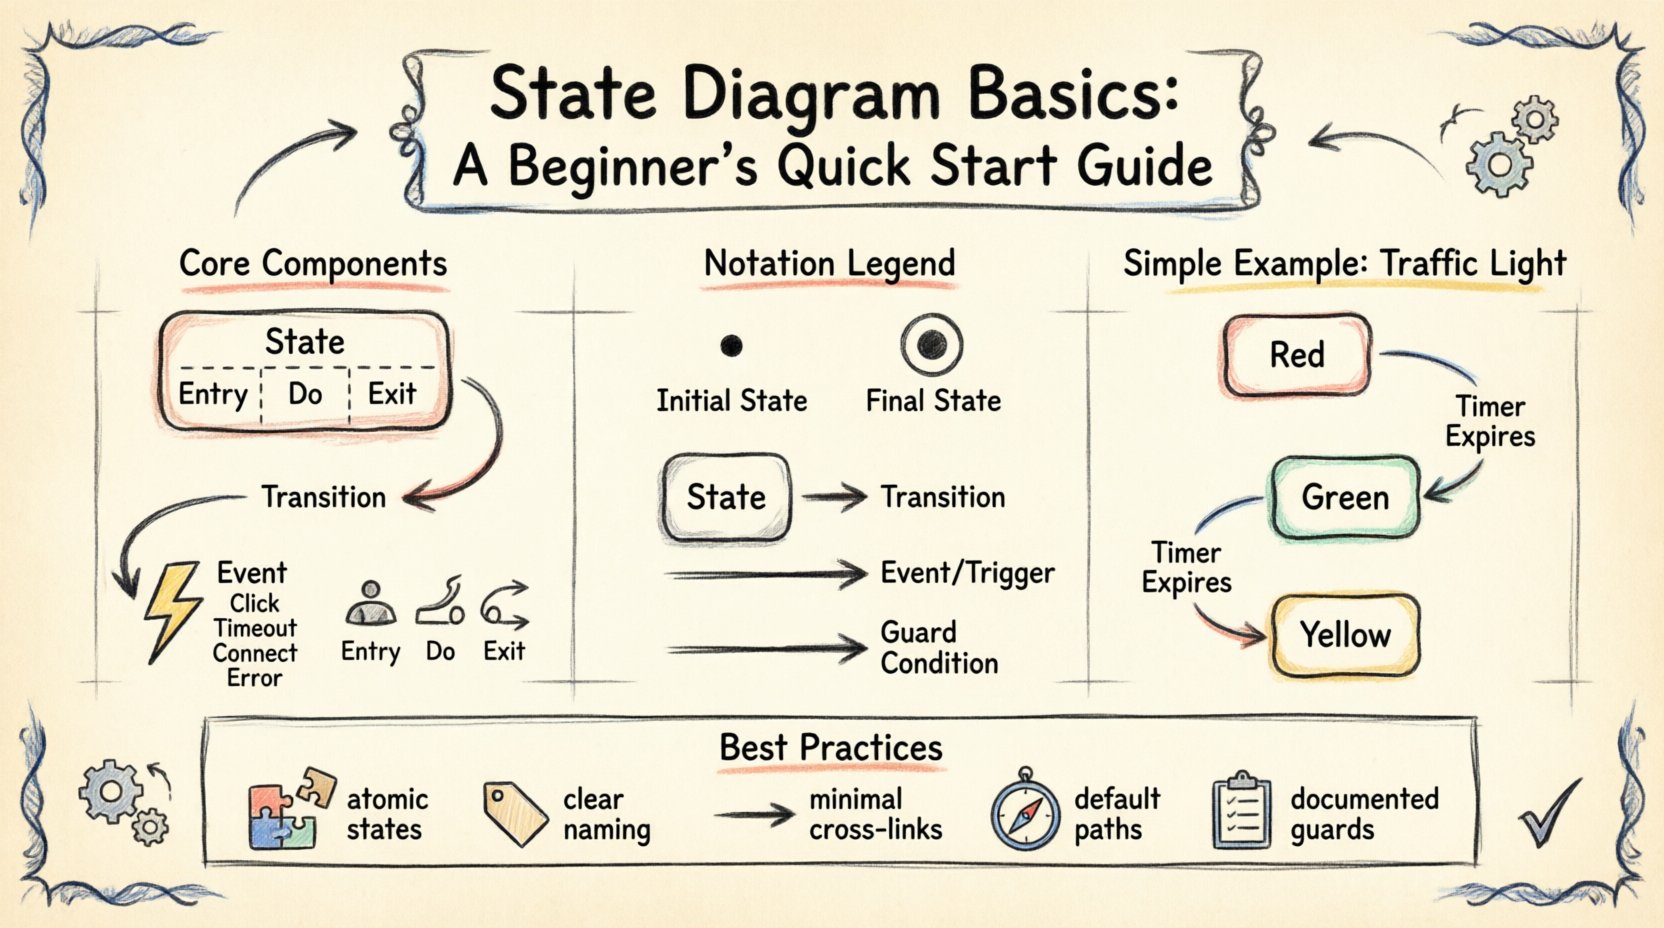
A state represents a condition during which an object or system waits for an event. It is a period of stability. You can visualize this as a box with rounded corners. Inside, you might find:
- State Name: A unique identifier like Idle, Loading, or Processing.
- Entry Action: What happens immediately upon entering.
- Do Activity: What happens continuously while in the state.
- Exit Action: What happens immediately before leaving.
2. Transitions
Transitions are the arrows connecting states. They indicate movement. A transition is not instantaneous; it is a response to an event. When an event occurs and the transition condition is met, the system moves from the source state to the target state.
3. Events
An event is a signal that triggers a transition. It can be user input, a timer expiration, or a signal from another system. Events are the catalysts for change. Common examples include:
- Click
- Timeout
- Connect
- Error
4. Actions
Actions are the activities performed in response to events. They are typically categorized by when they occur:
- Entry Action: Executed when entering the state.
- Do Action: Executed while remaining in the state.
- Exit Action: Executed when leaving the state.
📊 Understanding the Notation
Visual consistency ensures that engineers and stakeholders interpret the diagram the same way. Standard notation reduces miscommunication. Below is a breakdown of common symbols.
| Symbol | Meaning | Usage Example |
|---|---|---|
| Circle (Filled) | Initial State | The starting point of the system. |
| Circle (Double Ring) | Final State | The end of the process or lifecycle. |
| Rounded Rectangle | State | A distinct condition the system is in. |
| Arrow | Transition | Movement from one state to another. |
| Label on Arrow | Event / Trigger | What causes the movement (e.g., Submit). |
| Label with Slash | Guard Condition | A requirement that must be true to move (e.g., [Valid]). |
Notice the slash notation for guard conditions. This is critical for logic control. A transition might be available only if a specific variable meets a threshold. Without this, the system could move into an invalid state.
🏗️ Types of States You Will Encounter
Not all states are created equal. As systems grow in complexity, simple states are rarely enough. You will need to manage hierarchy and history.
Simple States
These are atomic states. They do not contain other states. They represent a single condition. For example, Powered Off is a simple state. The system is either off or it is not.
Composite States
A composite state contains sub-states. This allows for abstraction. You can define a general state like Online, which contains sub-states such as Idle, Transferring, and Syncing. This keeps the diagram clean while preserving detail where needed.
History States
History states allow a system to remember where it was before leaving a composite state. There are two types:
- Deep History: Remembers the last sub-state entered within a composite state.
- Shallow History: Remembers the last composite state entered, but not the specific sub-state.
This is useful for interruptible processes. If a user logs out and logs back in, the system can return to the exact screen they were on previously.
🔄 The Lifecycle of a State Transition
Understanding the sequence of events during a transition helps in debugging. When an event triggers a move, the following sequence occurs:
- Event Occurs: The trigger is detected.
- Transition Check: The system verifies guard conditions.
- Exit Action: Any actions defined for leaving the current state run.
- Transition Execution: The arrow is crossed.
- Entry Action: Any actions defined for entering the new state run.
- Do Activity: The system begins the internal activity of the new state.
This sequence ensures that cleanup happens before new logic starts. It prevents data corruption and ensures resource management is handled correctly.
🚦 Real-World Examples
Theory is useful, but application cements understanding. Let us look at three common scenarios where state diagrams are indispensable.
1. The Vending Machine
This is a classic example. The machine has distinct modes:
- Idle: Waiting for coins.
- Selection: Waiting for a product choice.
- Dispensing: Moving the item.
- OutOfOrder: Waiting for maintenance.
If the machine runs out of change during a sale, it must transition to Dispensing or Return Change. A state diagram ensures the logic handles these exceptions without crashing.
2. User Authentication Flow
Security systems require strict state control. A user login process might include:
- Logged Out: The default state.
- Authenticating: Checking credentials.
- Authenticated: Access granted.
- Locked Out: Too many failed attempts.
Transitions are guarded. For example, moving from Authenticating to Authenticated only happens if the password hash matches. Moving to Locked Out requires a counter variable to exceed a limit.
3. E-Commerce Order Status
Order management is heavily state-driven. An order moves through:
- Pending: Awaiting payment.
- Processing: Inventory check.
- Shipped: Item on the way.
- Delivered: Completed.
- Refunded: Reversed.
Not all transitions are allowed. You cannot move from Shipped directly to Processing without going through Returned first. The diagram enforces business rules.
🛡️ Best Practices for Design
Creating a diagram is only half the battle. Designing it for clarity and maintenance is the other half. Follow these guidelines to ensure longevity.
1. Keep States Atomic
Avoid combining unrelated logic into a single state. If a state requires two different timers, consider splitting it. Atomic states are easier to test and reason about.
2. Name States Clearly
Use nouns or noun phrases. Avoid verbs for state names. Instead of Logging In, use Authentication Process. The state is the condition, not the action.
3. Minimize Cross-Links
Complex diagrams often suffer from spaghetti logic. Try to keep transitions local. If you have many arrows crossing the middle of the diagram, consider using composite states to group related logic.
4. Define Default Transitions
Ensure every state has a defined path forward. Avoid dead ends unless they are intentional final states. Every valid state should eventually lead to a resolution or a stable waiting point.
5. Document Guard Conditions
Do not hide logic in comments. Write the condition on the transition line. If the condition is complex, define it as a named constant in your documentation.
📈 Benefits of State Modeling
Why invest time in drawing these diagrams? The value extends beyond documentation.
- Reduced Ambiguity: Stakeholders agree on behavior before code is written.
- Easier Debugging: When a bug occurs, you can trace the state path to find the error.
- Test Coverage: Every state and transition represents a test case.
- Scope Management: It is easier to identify when requirements are being added that disrupt the state flow.
- Code Structure: The diagram often maps directly to code patterns like the State Design Pattern.
⚖️ State Diagrams vs. Flowcharts
It is common to confuse state diagrams with flowcharts. While both show flow, their focus differs significantly.
| Feature | Flowchart | State Diagram |
|---|---|---|
| Focus | Process steps and logic flow. | System conditions and status. |
| Context | Specific instance of a task. | Long-term lifecycle of an object. |
| Loops | Often explicit loops. | Inherent in state cycles. |
| Parallelism | Difficult to represent. | Supported via concurrent states. |
| Usage | Algorithms, procedures. | UI logic, protocols, hardware control. |
If you are mapping a function, use a flowchart. If you are modeling the status of an object over time, use a state diagram.
🛠️ Building Your First Diagram
Ready to start? Here is a conceptual workflow for creating your first model.
- Identify the Object: What entity is changing state? (e.g., The Order, The User, The Device).
- List Conditions: What are the possible states? Write them down.
- Identify Triggers: What causes a change? List the events.
- Map Connections: Draw arrows between states based on triggers.
- Add Constraints: Add guard conditions where necessary.
- Review: Walk through the logic. Can you get stuck? Is every path clear?
Start simple. Do not try to model the entire system at once. Focus on one object. Once the logic is clear, you can expand it.
🔍 Common Pitfalls to Avoid
Even experienced designers make mistakes. Be aware of these common issues.
- State Explosion: Creating too many states makes the diagram unreadable. Use composite states to group them.
- Missing Transitions: Forgetting what happens when an error occurs. Always define error handling paths.
- Confusing Events with States: Ensure you are not naming states after actions. Clicking Button is not a state. Button Pressed is a state.
- Ignoring Timers: Many systems rely on timeouts. Ensure these are represented as events.
🧩 Advanced Concepts
As you gain experience, you will encounter more complex patterns. These concepts help manage high-level architecture.
Orthogonal Regions
Some objects exist in multiple independent dimensions. For example, a phone has a Power State (On/Off) and a Network State (Connected/Disconnected). Orthogonal regions allow you to model these parallel timelines within a single composite state.
Entry and Exit Points
When using composite states, you may need to enter or exit at specific points. Entry points define where the sub-state machine starts. Exit points define where it ends. This adds precision to the flow control.
📝 Final Thoughts
State diagrams are a powerful tool for clarity. They force you to think about the lifecycle of your system. By visualizing logic, you reduce the risk of defects and improve communication.
Start with the basics. Master the components. Practice on simple problems before tackling complex architectures. The effort you put into modeling pays off in maintainable code and reliable systems.
Remember, the goal is understanding, not just drawing. Use these diagrams as a living document. Update them as requirements change. They serve as the blueprint for your logic.