Introduction
In today’s rapidly evolving software development landscape, understanding system requirements from the user’s perspective has never been more critical. Use case diagrams stand as one of the most powerful yet often underutilized tools in the Unified Modeling Language (UML) arsenal. While many developers either overlook them or fail to grasp their full potential, use case diagrams serve as the bridge between stakeholder needs and technical implementation.

This comprehensive guide explores both traditional use case modeling techniques and the revolutionary AI-powered approaches that are transforming how we capture, analyze, and document system requirements. Whether you’re a business analyst, software architect, or developer, mastering use case diagrams will enhance your ability to design systems that truly meet user needs. We’ll dive deep into the fundamentals, explore practical examples, and demonstrate how modern AI tools are making use case modeling faster, more accurate, and more accessible than ever before.
What is a Use Case Diagram?

A UML use case diagram serves as the primary form of system/software requirements documentation for new software development projects. Unlike other modeling techniques that focus on implementation details, use cases specify what the system should do rather than how it should accomplish it.
Key Characteristics:
-
User-Centric Design: Use case modeling helps design systems from the end user’s perspective
-
Behavioral Focus: Specifies all externally visible system behavior in user-friendly terms
-
Dual Representation: Can be expressed both textually and visually
-
Simplicity Principle: Should remain simple with typically no more than 20 use cases
What Use Case Diagrams Don’t Show:
-
Detailed step-by-step processes
-
The exact order of operations
-
Internal system mechanics
-
Implementation-specific details

As illustrated in the UML diagram hierarchy above, use case diagrams belong to the behavioral diagram family, distinguishing them from structural diagrams that focus on system architecture.
Important Note: Use cases represent only functional requirements. Other requirements such as business rules, quality of service requirements, and implementation constraints must be documented separately using other UML diagram types.
Origin and Evolution of Use Case Modeling
While use case modeling is now synonymous with UML, its origins predate the Unified Modeling Language itself:
Historical Timeline:
-
1986: Ivar Jacobson first formulated textual and visual modeling techniques for specifying use cases
-
1992: The groundbreaking book “Object-Oriented Software Engineering – A Use Case Driven Approach” by Jacobson and colleagues popularized the technique for capturing functional requirements
-
Present Day: Use cases have become a standard practice in software development, now enhanced with AI-powered tools
Purpose and Benefits of Use Case Diagrams
Use case diagrams are typically developed during the early stages of system development and serve multiple critical purposes:
Primary Objectives:
✓ Specify System Context: Define the boundaries and scope of the system
✓ Capture Requirements: Document functional requirements from user perspective
✓ Validate Architecture: Ensure system design meets stakeholder needs
✓ Drive Implementation: Guide development teams with clear functional specifications
✓ Generate Test Cases: Create comprehensive testing scenarios
✓ Facilitate Communication: Bridge the gap between technical teams and domain experts
Use Case Diagram Components: A Visual Guide
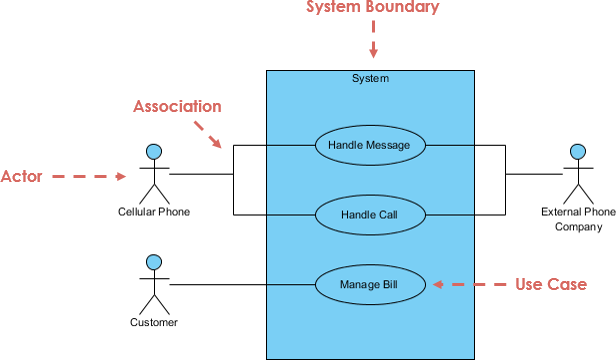
1. Actor

Definition: An entity that interacts with the system’s use cases
Key Characteristics:
-
Named using nouns
-
Represents a role in the business (not necessarily a specific user)
-
A single user can play multiple roles (e.g., a professor can be both instructor and researcher)
-
Triggers use cases
-
Has responsibilities toward the system (inputs) and expectations from the system (outputs)
2. Use Case

Definition: A system function or process (automated or manual)
Key Characteristics:
-
Named using verb + noun format (e.g., “Process Payment”)
-
Represents specific functionality
-
Each actor must be linked to at least one use case
-
Some use cases may exist without direct actor connections
3. Communication Link

Definition: Shows the participation of an actor in a use case
Key Characteristics:
-
Represented by a solid line connecting actor to use case
-
Indicates communication through messages
-
Shows association between actors and their respective use cases
4. System Boundary

Definition: Defines the scope of the system being modeled
Key Characteristics:
-
Can represent the entire system as defined in requirements
-
For large systems, each module can have its own boundary
-
Example: In an ERP system, modules like personnel, payroll, and accounting each form separate boundaries
-
The overall system can span multiple module boundaries
Structuring Use Case Diagrams with Relationships
Use cases share different types of relationships that model dependencies and enable reuse. Understanding these relationships is crucial for creating efficient, maintainable diagrams.
1. Extend Relationship

Purpose: Indicates optional or conditional behavior
Characteristics:
-
Shows that one use case may extend the behavior of another
-
Represented by a dotted arrow pointing to the base use case
-
Labeled with <> stereotype
-
Example: “Invalid Password” extends “Login Account”
-
The extending use case adds optional functionality
2. Include Relationship

Purpose: Reuses common functionality across multiple use cases
Characteristics:
-
Shows that one use case incorporates the behavior of another
-
Represented by a dotted arrow pointing to the included use case
-
Labeled with <> stereotype
-
Promotes reuse of common behavior
-
The base use case always includes the child use case behavior
3. Generalization Relationship

Purpose: Establishes parent-child relationships between use cases
Characteristics:
-
Child use case inherits behavior from parent use case
-
Child may add or override parent behavior
-
Represented by a solid arrow with triangle arrowhead
-
Arrow points from child to parent
-
Enables hierarchical organization of use cases
Traditional vs. AI-Powered Use Case Modeling
Traditional Approach
Manual Modeling Process:
-
Requires deep UML expertise
-
Time-consuming diagram creation
-
Manual identification of actors and use cases
-
Error-prone relationship mapping
-
Separate documentation efforts
-
Steep learning curve for beginners
Challenges:
-
Inconsistent modeling practices
-
Difficulty maintaining large diagrams
-
Limited automation
-
Time-intensive requirements elicitation
AI-Powered Revolution
Visual Paradigm’s AI ecosystem represents a paradigm shift in use case modeling, offering intelligent automation and enhanced productivity.
Multi-Platform AI Support:
VP Desktop: Generate Use Case Diagrams via AI and integrate with professional design tools
AI Chatbot: Draft and refine use case models through conversational interface at https://chat.visual-paradigm.com/
OpenDocs: Create and embed live Use Case Diagram pages directly into project documentation
Specialized AI Applications:
🛠️ Use Case Modeling Studio: End-to-end AI workspace from scope definition to complete Software Design Documents
📝 Description Generator: Instantly transform problem domains into specifications and PlantUML diagrams
⚡ Refinement Tool: Automatically apply UML best practices and <>/<> relationships
🔄 Use Case to Activity Diagram: Bridge textual elaboration to visual behavioral modeling
📋 Report Generator: Convert visual diagrams into structured, detailed Markdown documentation
Key AI Features Comparison:
| Feature | Traditional | AI-Powered |
|---|---|---|
| Diagram Creation | Manual drawing | Text-to-diagram generation |
| Relationship Mapping | Manual identification | Automatic suggestion |
| Documentation | Separate writing | Auto-generated |
| Test Cases | Manual creation | AI-generated from use cases |
| Learning Curve | Steep | Gentle with guidance |
| Consistency | Human-dependent | Enforced by AI |
| Time Required | Hours/Days | Minutes |
Practical Use Case Examples
Example 1: Association Link

This example demonstrates basic actor-use case associations, showing how users interact with system functionality through simple communication links.
Example 2: Include Relationship

The <> relationship showcases common behavior reuse. In this example, multiple use cases share common functionality, reducing redundancy and improving maintainability.
Example 3: Extend Relationship
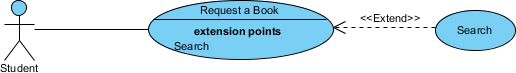
This diagram illustrates optional functionality through the <> relationship. The extension point “Search” demonstrates how additional behavior can be conditionally added to base use cases.
Example 4: Generalization Relationship

The generalization example shows inheritance between use cases, where child use cases inherit and potentially override parent behavior, creating a hierarchical structure.
Example 5: Vehicle Sales System

This comprehensive example demonstrates that even complex systems like vehicle sales can be effectively modeled with fewer than 10 use cases. Notice the strategic use of:
-
Extend relationships for optional features
-
Include relationships for shared functionality
-
Clear actor-use case associations
-
Well-defined system boundaries
How to Identify Actors
Identifying actors is often the easiest starting point for requirements elicitation. Ask these key questions (Schneider and Winters, 1998):
Actor Identification Questions:
-
Who uses the system?
-
Who installs the system?
-
Who starts up the system?
-
Who maintains the system?
-
Who shuts down the system?
-
What other systems use this system?
-
Who gets information from this system?
-
Who provides information to the system?
-
Does anything happen automatically at a predetermined time?
How to Identify Use Cases
Once actors are identified, focus on what value each actor desires from the system:
Use Case Identification Questions:
-
What functions will the actor want from the system?
-
Does the system store information? What actors will create, read, update, or delete this information?
-
Does the system need to notify an actor about changes in internal state?
-
Are there external events the system must know about? What actor informs the system of those events?
Best Practices and Tips
Effective Use Case Modeling:
✓ Actor-Centric Organization: Always structure diagrams from the actor’s perspective
✓ Start Simple: Begin with high-level views before refining details
✓ Focus on “What”: Emphasize functionality over implementation
✓ Maintain Simplicity: Limit to 20 or fewer use cases per diagram
✓ Use Proper Granularity: Match detail level to project needs
✓ Leverage AI Tools: Utilize AI-powered refinement and validation
Common Pitfalls to Avoid:
✗ Including implementation details
✗ Creating overly complex diagrams
✗ Mixing different levels of abstraction
✗ Forgetting system boundaries
✗ Neglecting optional behaviors (extend relationships)
Use Case Levels of Detail
Understanding granularity is essential for effective use case modeling. Alastair Cockburn’s “sea level” metaphor provides an excellent framework:

Granularity Levels:
High-Level (Cloud/Sea Level):
-
Overview diagrams
-
Strategic planning
-
Stakeholder communication
-
System scope definition
Mid-Level (Fish/Kite Level):
-
User goal level
-
Standard use case detail
-
Development planning
-
Team coordination
Detailed Level (Clam/Invertebrate):
-
Step-by-step specifications
-
Implementation details
-
Test case generation
-
Exception handling
Key Insight: Use case diagrams typically serve as high-level blueprints, while detailed specifications can be documented separately and linked from the diagrams.
The AI Ecosystem Advantage
Visual Paradigm’s comprehensive AI ecosystem transforms use case modeling from a manual, time-consuming task into an intelligent, automated process.
Core AI Capabilities:
Automated Modeling & Diagramming:
-
Text-to-Diagram: Generate Use Case, Activity, Sequence, Class, and ER diagrams from simple prompts
-
Diagram Refinement: Automatic suggestion of <> and <> relationships
-
Activity Diagram Generator: Map detailed narratives to visual flowcharts
Advanced Requirements Analysis:
-
AI Use Case Description: Auto-generate preconditions, postconditions, and flow descriptions
-
Scenario Analyzer: Convert text to structured decision tables
-
Textual Analysis: Identify domain classes, attributes, and operations automatically
Documentation & Testing:
-
AI-Powered Test Case Creation: Generate test scenarios from use case specifications
-
Automated SDD Reporting: Create professional Software Design Documents with one click
-
Gherkin Scenario Generation: Convert flows to automated testing format
Integration & Workflow:
-
Desktop & Web Sync: Seamless transition between VP Online and Desktop
-
Interactive Dashboard: Real-time project health monitoring
-
Collaborative Features: Team-based modeling and review
Conclusion
Use case diagrams remain one of the most valuable tools in software development, bridging the gap between user needs and technical implementation. While the fundamental principles of use case modeling have remained consistent since Ivar Jacobson’s pioneering work in the 1980s, the tools and techniques available today have evolved dramatically.
The introduction of AI-powered modeling tools has democratized use case diagram creation, making it faster, more accurate, and accessible to practitioners at all skill levels. What once required hours of manual work and deep UML expertise can now be accomplished in minutes through intelligent automation, without sacrificing quality or rigor.
Whether you choose traditional manual modeling or embrace AI-powered tools, the key to success lies in understanding the fundamental concepts: identifying the right actors, capturing meaningful use cases, establishing proper relationships, and maintaining appropriate levels of detail. Use case diagrams are not just documentation—they are communication tools that ensure everyone involved in a project shares a common understanding of what the system should do.
As software systems continue to grow in complexity, the ability to clearly articulate requirements from the user’s perspective becomes increasingly critical. Master use case diagrams, leverage modern AI tools when appropriate, and you’ll be well-equipped to design systems that truly meet user needs and drive project success.
Ready to start? Download Visual Paradigm Community Edition for free and begin creating your own use case diagrams today, or explore the AI-powered Use Case Modeling Studio to experience the future of requirements engineering.
References
-
New Diagram Types Added to AI Diagram Generator: DFD & ERD: This release announcement details the expanded capabilities of the AI generator, which now includes support for the automated creation of Data Flow Diagrams (DFD).
-
Mastering AI-Driven Systems Engineering: A Comprehensive Guide to ArchiMate and SysML Diagram Generation: This case study demonstrates how Visual Paradigm’s AI-powered chatbot improves efficiency in system modeling and specifically highlights its role in data flow diagram creation.
-
Visual Paradigm’s AI Diagram Generator Expands Instant Creation Capabilities: This article explores how the AI generator has been updated to support the instant creation of DFDs and other models to streamline information flow analysis.
-
AI Textual Analysis – Transform Text into Visual Models Automatically: This feature overview describes how AI analyzes text documents to automatically generate various visual models, facilitating faster documentation and modeling for business and software systems.
-
AI Diagram Generator Supports 13 Diagram Types: An official update noting that the AI diagram generator now supports 13 different diagram types, providing enhanced modeling flexibility for architects and developers.
-
How to Create Data Flow Diagram (DFD)? – Visual Paradigm: A foundational tutorial that explains how to visually depict data movement through system processes, which serves as the basis for AI-driven generation and refinement.
-
Demystifying Information Flow with DFDs: A comprehensive guide that explains the conceptual framework of DFDs and how they are used to model information movement across various system components.
-
Mastering Data Flow Diagrams with Visual Paradigm: An in-depth guide that explores advanced modeling tools and best practices for creating complex DFDs within a professional software environment.
-
Data Flow Diagram Templates – Visual Paradigm: This resource provides a library of ready-to-use DFD templates that visualize how data moves within business information systems, aiding in rapid prototyping.
-
Unlock the Power of Data Flow Diagrams (DFD) with Visual Paradigm: This guide discusses the comprehensive ecosystem provided for DFD modeling, emphasizing its role in efficient design and team collaboration.