In modern system architecture, the ability to visualize data flow and component interaction is critical. When engineers map out how information moves through a system, they often face a fundamental choice: should they represent the structure of connections or the flow of interactions over time? This decision defines whether a communication diagram remains static or becomes dynamic. Understanding the distinction between these two modeling approaches ensures that technical documentation accurately reflects the reality of the software being built.
Communication diagrams serve as a bridge between abstract requirements and concrete implementation. They illustrate how objects or components relate to one another and how messages pass between them. However, not all diagrams serve the same purpose. Some focus on the skeletal structure, while others capture the pulse of the system in motion. Selecting the correct view impacts everything from onboarding new team members to debugging complex production issues.
Understanding Static Communication Diagrams 🏗️
A static communication diagram focuses on the structural relationships between system elements. It acts as a snapshot of the architecture, showing what exists and how components are linked, regardless of when or how they interact. This approach is rooted in the concept of a structural model, where the emphasis lies on the existence of associations, aggregations, and dependencies.
When you utilize a static view, you are answering questions about the composition of the system. It answers inquiries such as:
- Which components are connected?
- What is the hierarchy of the objects?
- How many instances of a component are required?
- What are the interfaces exposed by a specific module?
These diagrams are particularly useful during the initial design phase. They provide a blueprint that allows architects to verify if the necessary components exist to support the intended functionality. Without a static foundation, dynamic behaviors have no place to reside. You cannot have a conversation if there is no one to speak to.
Key Characteristics of Static Views
- Time Independence: The diagram does not convey a sequence or duration. It represents a state of being rather than an event.
- Relationship Focus: Lines between nodes indicate relationships like “uses,” “owns,” or “depends on.”
- Component Definition: Nodes typically represent classes, subsystems, or hardware units.
- Stability: Structural relationships tend to change less frequently than behavioral flows.
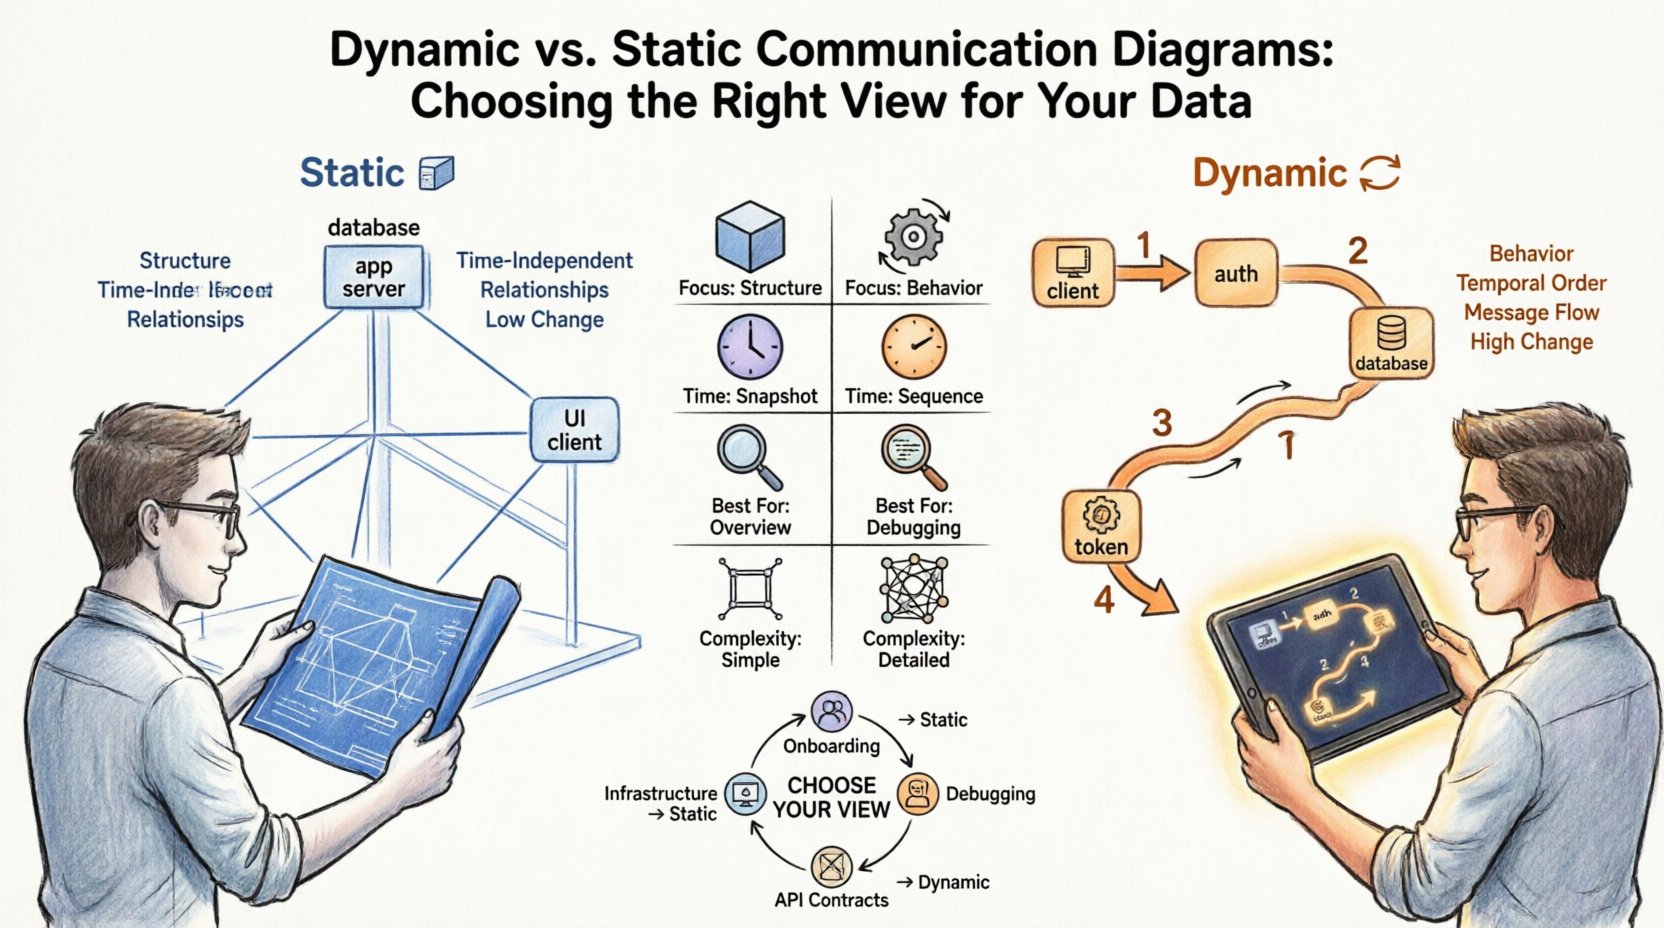
In practice, a static communication diagram might show a database server connected to an application server, which is in turn connected to a user interface client. It tells you the topology of the network or the software stack, but it does not tell you how a request travels from the client to the database.
Understanding Dynamic Communication Diagrams 🔄
Conversely, a dynamic communication diagram captures the behavior of the system over time. It illustrates the sequence of events, the exchange of messages, and the state changes that occur during a specific operation. This view is essential for understanding the logic that drives the application and how data transforms as it moves through the architecture.
When you switch to a dynamic view, you are addressing the runtime environment. You are simulating the execution of a process. This is where the abstract connections from the static model come to life. The diagram becomes a narrative of interaction.
Dynamic diagrams are indispensable for:
- Identifying bottlenecks in data processing.
- Verifying error handling paths.
- Defining API contracts between services.
- Planning for load balancing and concurrency.
Key Characteristics of Dynamic Views
- Temporal Ordering: Messages are numbered or sequenced to show the order of execution.
- Message Flow: Arrows indicate the direction of data or control signals.
- State Changes: Nodes may represent objects in specific states (e.g., “Initializing,” “Processing,” “Completed”).
- Conditional Logic: Branches can represent if-then logic within the flow.
For example, a dynamic diagram might show a user login request passing from the client to an authentication service, which queries a database, and then returns a token to the client. This sequence reveals the dependencies and the potential points of failure in the authentication process.
Key Differences at a Glance 🆚
To make an informed decision, it is helpful to compare the two approaches side by side. The table below outlines the primary distinctions between static and dynamic communication diagrams.
| Feature | Static Communication Diagram | Dynamic Communication Diagram |
|---|---|---|
| Primary Focus | Structure and Relationships | Behavior and Interaction |
| Time Dimension | Absent (Snapshot) | Present (Sequence/Flow) |
| Change Frequency | Low (Architecture changes slowly) | High (Logic evolves frequently) |
| Best For | System Overview, Deployment | API Design, Debugging, Workflow |
| Complexity | Visual Clarity, Fewer Lines | High Detail, More Arrows |
| Data Context | Data Stores and Types | Data Payloads and Transformations |
This comparison highlights that neither approach is superior; they serve different stages of the development lifecycle. Using a static diagram to describe a workflow is confusing, just as using a dynamic diagram to describe a deployment topology is inefficient.
Decision Framework for Selection 🧭
Choosing the right view requires an analysis of the current project phase and the specific problem you are trying to solve. There is no one-size-fits-all solution. The decision matrix below provides a guide based on common scenarios.
Scenario 1: Onboarding New Developers
If the goal is to help a new engineer understand the system, start with a static communication diagram. They need to know where the code lives, how the services are named, and what the major boundaries are. A dynamic diagram might overwhelm them with implementation details before they understand the layout.
Scenario 2: Debugging a Production Issue
When a specific transaction fails, a dynamic communication diagram is necessary. You need to trace the path of the request to see where it stalled. Did the payment service fail? Was the timeout too short? Static views cannot show the failure point.
Scenario 3: Defining API Contracts
For teams building microservices, the interface definitions are critical. A dynamic view clarifies the expected inputs and outputs for each endpoint. It ensures that the consumer knows exactly what to send and what to expect back.
Scenario 4: Infrastructure Planning
When provisioning servers or configuring networks, a static view is preferred. It shows the required hardware, the network segments, and the storage requirements. Time is irrelevant here; capacity and connectivity are the priorities.
Maintenance and Evolution 🛠️
One of the most common challenges in system design is keeping diagrams up to date. Static diagrams tend to remain valid for longer periods. The fundamental structure of a system rarely changes every sprint. However, dynamic diagrams require constant attention. Business logic evolves, new features are added, and error handling strategies change.
To maintain the integrity of your documentation:
- Version Control: Treat diagrams as code. Store them in the repository alongside the source files.
- Trigger Updates: Link diagram updates to code review pull requests. If the logic changes, the diagram must reflect that change.
- Automate Where Possible: Use tools that can generate static diagrams from code structures to reduce manual effort.
- Regular Audits: Schedule quarterly reviews of dynamic diagrams to ensure they match the current deployment.
Ignoring maintenance leads to “diagram drift.” When documentation no longer matches the code, it becomes a liability rather than an asset. Developers will stop reading the diagrams and rely solely on the code, which defeats the purpose of the documentation.
Common Pitfalls to Avoid ⚠️
Even with the right framework, teams often make mistakes when modeling communication. Being aware of these pitfalls helps you produce clearer and more useful artifacts.
Over-Complexity in Static Models
Do not attempt to show every single dependency in a static diagram. Focus on the high-level connections. If a diagram has hundreds of lines, it is likely too detailed. Abstract complex modules into single nodes to maintain clarity.
Ignoring Asynchronous Flows
In dynamic diagrams, many systems rely on asynchronous messaging queues. Do not force a synchronous line-to-line representation for these interactions. Use dashed lines or specific markers to indicate that a response is not immediate. This prevents confusion regarding performance expectations.
Mixing Levels of Abstraction
Do not mix class-level details with infrastructure-level details in the same diagram. Keep your dynamic diagrams focused on application logic and your static diagrams focused on deployment or component structure. Mixing them creates noise.
Neglecting Error Paths
It is tempting to draw the “Happy Path” only. However, a dynamic diagram is most valuable when it shows what happens when things go wrong. Include error handling branches. Show what happens when a service returns a 500 error or when a timeout occurs.
Integrating with Broader Architecture 🧩
Communication diagrams do not exist in isolation. They are part of a larger ecosystem of design models. To maximize their value, integrate them with other standard modeling techniques.
- Class Diagrams: Use static communication diagrams to complement class diagrams. While class diagrams show attributes and methods, communication diagrams show how those objects interact.
- Sequence Diagrams: Sequence diagrams are a specialized form of dynamic communication. They emphasize time strictly. Use communication diagrams when you need to show the topology of the interaction more than the exact timing.
- Activity Diagrams: Use activity diagrams for high-level workflows and communication diagrams for the specific object interactions within those workflows.
This integration ensures that the architectural vision remains consistent across all documentation layers. A change in one diagram should ideally trigger a review of the others to maintain alignment.
Summary of Best Practices ✅
Effective communication diagramming is about clarity and precision. Whether you choose a static or dynamic view, the goal is to reduce cognitive load for the reader.
Here are the core takeaways for your next project:
- Know Your Audience: Architects need static views; developers need dynamic views.
- Keep It Simple: Remove unnecessary details that clutter the visual space.
- Stay Consistent: Use standard notation for arrows, nodes, and labels across all diagrams.
- Validate Regularly: Ensure the diagram matches the deployed system.
- Focus on Data: Always label the data being transferred to provide context.
By carefully selecting the appropriate view for your data, you create a living document that supports the development lifecycle. Static diagrams provide the map, while dynamic diagrams provide the directions. Together, they ensure that the team navigates the system architecture with confidence and precision.