In the fast-paced world of business strategy, intuition often gets mistaken for insight. Many leaders rely on gut feelings or outdated anecdotes when deciding where their organization stands relative to competitors. This approach introduces significant risk. Without empirical evidence, assumptions about market share, brand perception, or operational efficiency remain fragile. To build a resilient strategy, you must move beyond speculation and adopt a rigorous, evidence-based methodology.
This guide explores how to transform the classic SWOT framework into a data-driven engine for decision-making. By integrating hard metrics with qualitative insights, you can accurately map your internal capabilities against external market forces. The goal is not just to list factors, but to quantify their impact on your trajectory. 📈
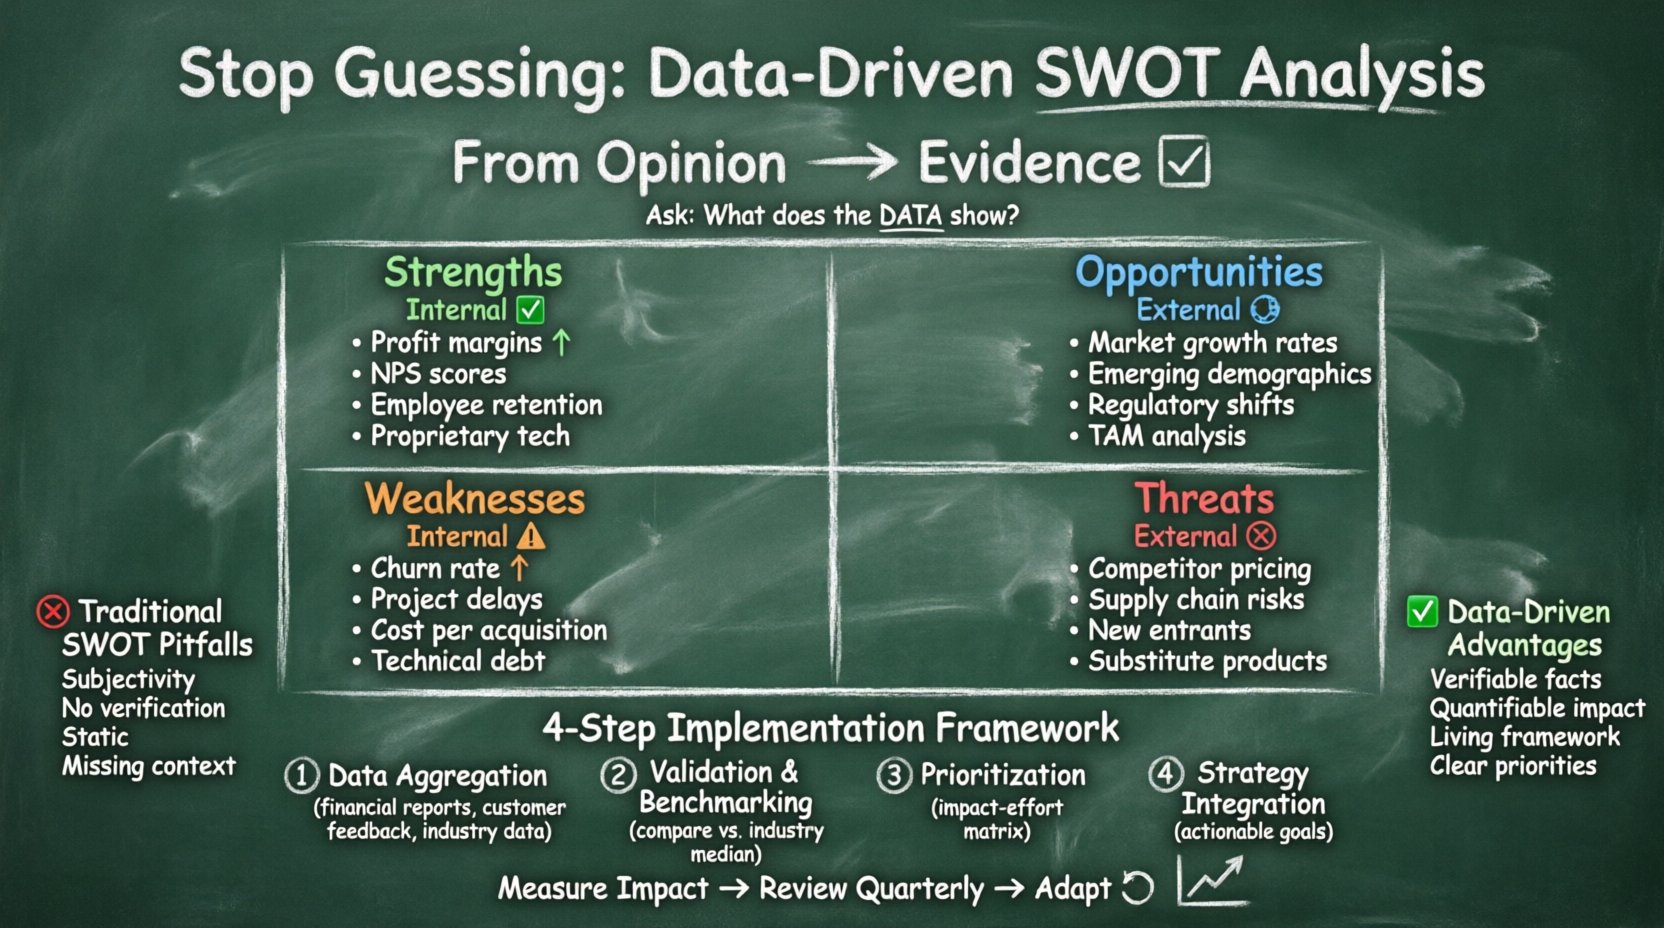
Why Traditional SWOT Analysis Often Falls Short 🛑
The SWOT matrix (Strengths, Weaknesses, Opportunities, Threats) has been a staple of strategic planning for decades. However, its traditional application frequently suffers from subjectivity. When teams brainstorm without data, the output often reflects the loudest voice in the room rather than the reality of the business environment.
Common issues with standard SWOT exercises include:
- Subjectivity: Perceptions of “strength” vary between departments. Sales might view price as a strength, while finance sees it as a margin risk.
- Lack of Verification: Claims are rarely backed by historical performance or market research.
- Static Nature: A completed analysis often sits on a shelf, never updated as market conditions shift.
- Missing Context: Internal weaknesses are noted without comparing them to industry benchmarks.
When you skip the data layer, you are essentially planning a route without a map. A data-driven approach corrects these biases by anchoring every observation in verifiable facts.
The Data-Driven Shift: From Opinion to Evidence 📉
Integrating data into the SWOT process requires a shift in how information is gathered and categorized. It moves the conversation from “What do we think?” to “What does the evidence show?”. This does not mean eliminating human insight; rather, it validates that insight.
To achieve this, you need to define specific metrics for each quadrant before the analysis begins. This ensures that every bullet point in your matrix serves a strategic purpose. Below is a breakdown of the types of data required for each section.
Data Sources for Each Quadrant
| Quadrant | Focus Area | Key Data Points | Internal vs. External |
|---|---|---|---|
| Strengths | Internal Capabilities | Profit margins, employee retention rates, proprietary technology | Internal |
| Weaknesses | Internal Limitations | Customer churn, project delay rates, cost per acquisition | Internal |
| Opportunities | External Growth | Market growth rates, emerging demographics, regulatory changes | External |
| Threats | External Risks | Competitor pricing, supply chain volatility, new entrants | External |
By aligning your analysis with these data points, you ensure the output is actionable. You can prioritize resources based on where the data indicates the highest leverage.
Deep Dive: Strengths and Weaknesses (Internal Factors) 🏗️
Internal factors are within your control. However, identifying them accurately requires honesty and access to performance records. Many organizations struggle to see their weaknesses because of internal culture or lack of reporting infrastructure.
Identifying Strengths with Metrics
A strength is not just a capability; it is a capability that provides a competitive advantage. To validate a strength, compare your performance against the median of your industry.
- Operational Efficiency: Look at cycle times. If your product delivery takes 2 days and the industry average is 5 days, that is a quantifiable strength.
- Brand Loyalty: Measure Net Promoter Score (NPS) or Customer Lifetime Value (CLV). High retention rates indicate a strong brand foundation.
- Intellectual Property: Document patents or proprietary algorithms that prevent competitors from replicating your service.
Uncovering Weaknesses Objectively
Weaknesses are often the hardest to admit. They require looking at areas where you underperform compared to peers or where costs are disproportionately high. Data removes the emotional defense mechanism.
- Resource Constraints: Analyze headcount ratios. Are you understaffed in critical roles compared to revenue generation?
- Technical Debt: Review system downtime or bug resolution times. Outdated infrastructure slows innovation.
- Market Penetration: If your growth rate is lower than the sector average, your market penetration strategy may be flawed.
When listing weaknesses, avoid vague terms like “poor marketing.” Instead, specify “Marketing qualified leads conversion rate is 2% below industry benchmark.” Specificity allows for targeted remediation.
Deep Dive: Opportunities and Threats (External Factors) 🌍
External factors are outside your control, but they dictate the environment in which you operate. You cannot stop a competitor from launching a product, but you can anticipate it and prepare a counter-strategy. This requires continuous market monitoring.
Validating Opportunities
An opportunity is only viable if there is demand and if you have the capacity to capture it. Do not confuse a trend with a viable opportunity.
- Market Segments: Identify underserved niches. Use search volume data to see if consumer interest is rising in specific areas.
- Regulatory Shifts: New laws often create demand for compliance services or new product categories.
- Technological Adoption: If a new technology reduces costs for your customers, you can position your solution as a cost-saving measure.
Validate these opportunities by estimating the Total Addressable Market (TAM) for the specific segment. If the potential revenue does not justify the investment, it is not a viable opportunity.
Assessing Threats Quantitatively
Threats are risks to your market share or profitability. A data-driven approach assesses the probability and impact of these threats.
- Competitor Pricing: Monitor competitor price changes. A sudden drop can indicate a shift in their strategy that threatens your margins.
- Supply Chain Risks: Track supplier reliability scores. Dependency on a single vendor is a quantifiable risk.
- Substitute Products: Analyze customer feedback for mentions of alternative solutions. If customers are switching to substitutes at a high rate, this is a critical threat.
Assign a risk score to each threat based on likelihood and severity. This helps you decide which threats require immediate mitigation and which can be monitored.
Implementation: A Step-by-Step Framework 🛠️
Conducting a data-driven SWOT analysis requires discipline. It is not a one-time meeting but a process. Follow these steps to ensure the analysis is robust and useful.
Step 1: Data Aggregation
Gather all relevant internal and external data. This includes financial reports, customer feedback, industry reports, and operational logs. Ensure the data is recent. Information from three years ago is likely irrelevant for current strategic planning.
Step 2: Validation and Benchmarking
Compare your internal data against industry standards. If you claim a strength, verify it against the market average. If you claim a weakness, check if it is common across the industry or unique to your organization.
Step 3: Prioritization
You cannot fix everything at once. Use an impact-effort matrix to prioritize items from your SWOT list. Focus on high-impact, low-effort strengths to leverage, and high-impact, high-priority threats to mitigate.
Step 4: Strategy Integration
Translate the findings into actionable goals. If a weakness is high customer churn, the strategy must include a retention initiative. If an opportunity is a new market segment, the strategy must include a market entry plan.
Common Pitfalls to Avoid ⚠️
Even with data, the analysis process is prone to errors. Awareness of these pitfalls helps maintain the integrity of the strategy.
- Confirmation Bias: Collecting data only to support a preconceived notion. Be open to evidence that contradicts your hypothesis.
- Data Overload: Trying to analyze every metric. Focus on key performance indicators (KPIs) that directly influence the strategic outcome.
- Static Reporting: Treating the SWOT as a document to be filed. It should be a living framework reviewed quarterly.
- Ignoring Qualitative Data: Numbers tell the “what,” but interviews tell the “why.” Combine customer sentiment with financial metrics.
Measuring the Impact of Your Analysis 📏
The value of this process is realized in the execution phase. You need to track whether the strategies derived from the SWOT analysis are delivering results.
Establish a feedback loop where you review the original data points after a set period. Did the churn rate improve after addressing the internal weakness? Did the new market segment contribute to revenue as projected? This review cycle validates the accuracy of your initial assessment.
Keep the following in mind for ongoing measurement:
- Baseline Metrics: Record the state of affairs before implementing changes.
- Regular Audits: Schedule monthly or quarterly reviews of the data sources.
- Adaptability: Be willing to update the SWOT matrix if the external environment shifts dramatically.
Applying This to Different Business Models 🏢
The principles of data-driven SWOT apply across various sectors, but the specific metrics will differ.
For Service-Based Businesses
Focus on capacity utilization, billable hours, and client satisfaction scores. Your strengths often lie in your talent pool and delivery speed.
For Product-Based Businesses
Focus on inventory turnover, unit economics, and distribution reach. Your strengths might be in supply chain efficiency or product durability.
For Digital Platforms
Focus on user engagement, daily active users, and conversion funnels. Your strengths are often in network effects or data accumulation.
Final Thoughts on Strategic Clarity 🧭
Strategic clarity comes from knowing exactly where you stand and where you are going. Guessing your market position is a gamble that can cost significant resources. By grounding your SWOT analysis in data, you reduce uncertainty and increase the probability of success.
This approach does not eliminate risk, but it illuminates it. You can see the obstacles and the paths forward with greater precision. It transforms the SWOT analysis from a theoretical exercise into a practical tool for growth. Start gathering your data, challenge your assumptions, and build a strategy that stands on solid ground.
Remember, the goal is not perfection, but accuracy. As long as your decisions are based on the best available information, you are moving in the right direction. Stay vigilant, keep updating your data, and let the numbers guide your leadership.