In the landscape of software development, clear communication is the backbone of successful architecture. Object-Oriented Analysis and Design (OOAD) relies heavily on standardized visual languages to bridge the gap between abstract requirements and concrete implementation. The Unified Modeling Language (UML) serves as this universal standard, providing a structured way to visualize, specify, construct, and document the artifacts of a software system. This guide explores the essential UML diagram types, their specific use cases, and how they integrate into the design lifecycle.
Understanding UML Fundamentals 🧠
UML is not a programming language. It is a modeling language used to describe the structure and behavior of systems. Developed in the 1990s and maintained by the Object Management Group (OMG), it has become the de facto standard for software engineering documentation. Using a visual notation allows stakeholders to understand complex systems without needing to read thousands of lines of code.
When approaching a design project, the goal is not to create diagrams for the sake of diagrams. Instead, each diagram must serve a specific purpose. Whether documenting the static structure of the code or the dynamic interactions between components, UML provides the tools to clarify intent. This reduces ambiguity during the development phase and aids in maintenance later.
Categorizing Diagrams: Structural vs. Behavioral 📊
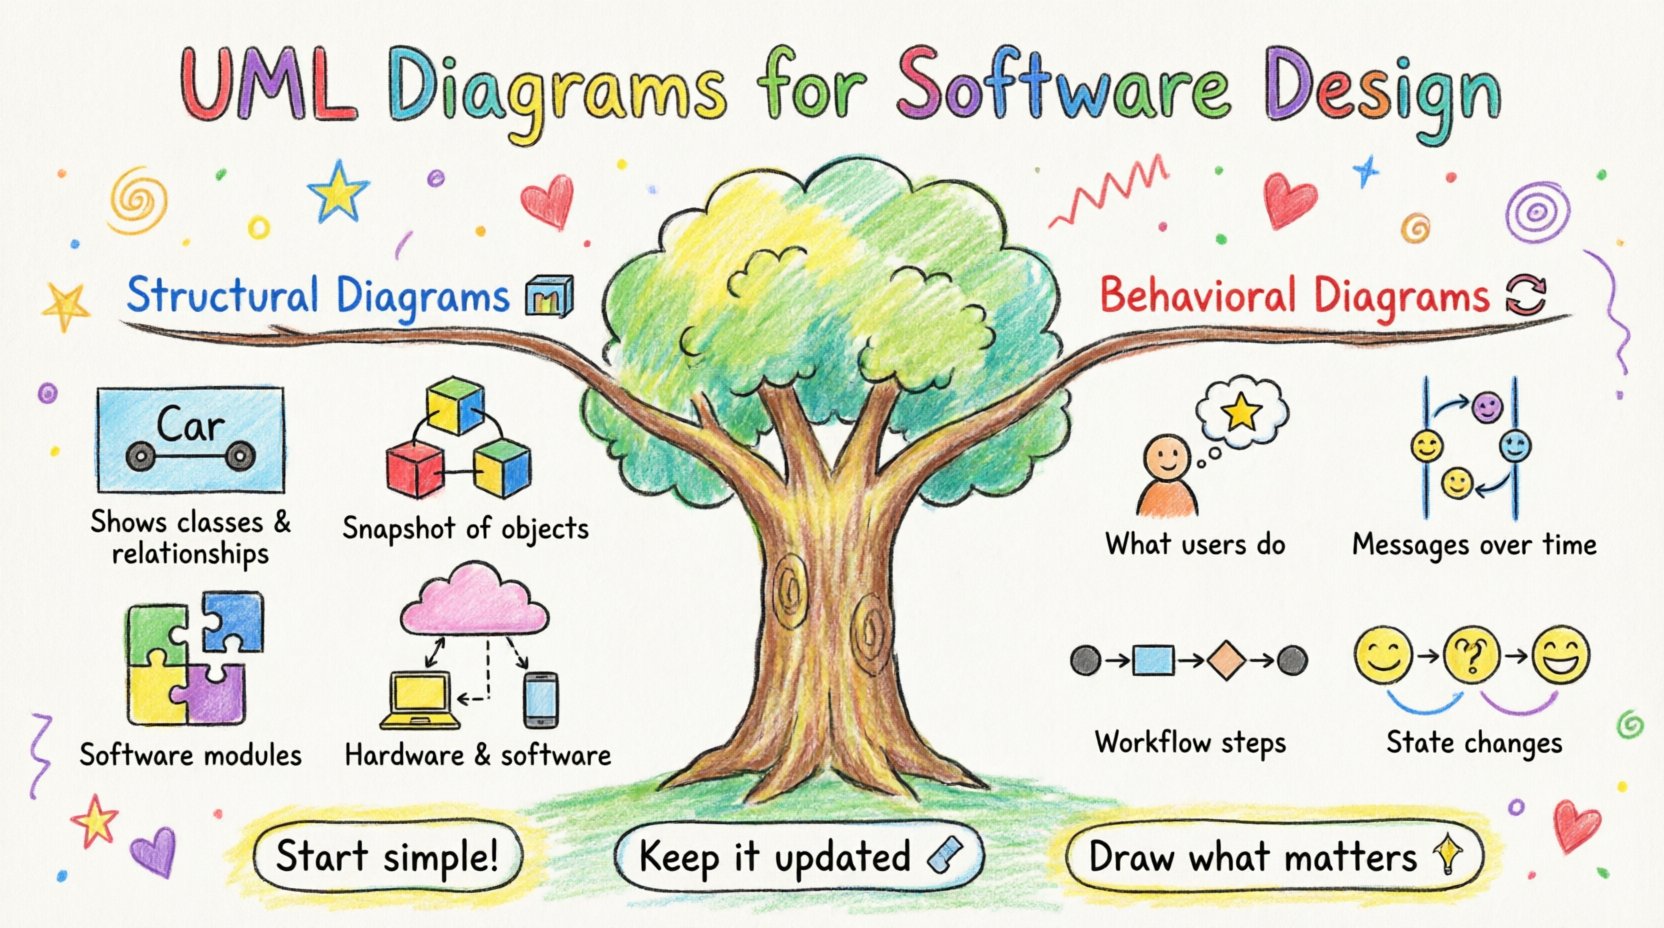
UML diagrams are broadly categorized into two groups: Structural and Behavioral. Understanding the distinction is crucial for selecting the right tool for the job.
- Structural Diagrams: These represent the static aspect of the system. They show the things that make up the system, such as classes, objects, components, and nodes.
- Behavioral Diagrams: These represent the dynamic aspect of the system. They show how the system behaves over time, including interactions, state changes, and workflows.
The table below summarizes the primary diagram types within these categories.
| Category | Diagram Type | Purpose |
|---|---|---|
| Structural | Class Diagram | Shows class structure and relationships |
| Structural | Object Diagram | Snapshot of instances at a specific time |
| Structural | Component Diagram | High-level organization of software |
| Structural | Deployment Diagram | Hardware architecture and software deployment |
| Behavioral | Use Case Diagram | Functional requirements and actor interactions |
| Behavioral | Sequence Diagram | Time-ordered interactions between objects |
| Behavioral | Activity Diagram | Workflow logic and business processes |
| Behavioral | State Machine Diagram | State transitions of an object |
Structural Diagrams: The Backbone of Design 🏗️
Structural diagrams define the anatomy of the software. They remain relatively stable throughout the development process, unlike behavioral diagrams which may change frequently as logic evolves.
1. Class Diagram 📦
The Class Diagram is the most widely used diagram in UML. It maps out the static structure of the system. It describes the system by showing classes, their attributes, operations, and the relationships among objects.
- Attributes: Data members within a class (e.g.,
userName,price). - Operations: Methods or functions available to the class (e.g.,
calculateTotal()). - Relationships:
- Association: A structural relationship between objects (e.g., a
Studentis associated with aCourse). - Inheritance: Generalization (e.g., a
Manageris a type ofEmployee). - Aggregation: A “whole-part” relationship where the part can exist independently.
- Composition: A stronger form of aggregation where the part cannot exist without the whole.
- Association: A structural relationship between objects (e.g., a
2. Object Diagram 🖼️
While a Class Diagram defines the blueprint, an Object Diagram shows a snapshot of the system at a specific moment. It displays instances of classes and the links between them. This is particularly useful for verifying the correctness of a Class Diagram or for debugging complex interactions.
- Objects are named with the class name preceded by a colon (e.g.,
Customer: John). - Links between objects represent associations between classes.
- Attributes display their current values (e.g.,
John.age = 30).
3. Component Diagram ⚙️
Component Diagrams describe the organization and dependencies among a set of components. A component is a modular part of a system that encapsulates its implementation. This diagram helps developers understand the physical structure of the software and how modules interact.
- Components can represent libraries, executables, or database schemas.
- Interfaces are shown as small circles (provided) or lollipop shapes (required).
- Dependencies show which components rely on others to function.
4. Deployment Diagram 🖥️
Deployment Diagrams depict the physical architecture of the system. They show the hardware nodes (servers, routers, devices) and the software artifacts deployed on them. This is critical for system administrators and DevOps engineers to visualize infrastructure requirements.
- Nodes represent physical hardware or virtual machines.
- Artifacts are the software files running on the nodes.
- Communication paths show network connections between nodes.
Behavioral Diagrams: Capturing Dynamics 🔄
Behavioral diagrams describe the actions and interactions that occur within the system. They are essential for understanding the flow of control and data.
5. Use Case Diagram 🎯
Use Case Diagrams capture the functional requirements of a system. They focus on the interactions between external actors (users or other systems) and the system itself.
- Actors: Represented by stick figures. They initiate use cases but are not part of the system.
- Use Cases: Represented by ellipses. They describe a specific goal the actor wants to achieve.
- Relationships:
- Association: Links actors to use cases.
- Include: A use case that is always part of another use case.
- Extend: A use case that adds optional behavior to another.
6. Sequence Diagram 📅
Sequence Diagrams are interaction diagrams that detail how operations are carried out. They capture the interaction between objects in terms of an exchange of messages over time. Time is represented vertically, from top to bottom.
- Lifelines: Vertical dashed lines representing objects.
- Messages: Arrows showing calls or returns between objects.
- Activation Bars: Rectangles on lifelines showing when an object is performing an action.
- Combined Fragments: Boxes with labels like
alt(alternative),opt(optional), orloopto show control flow logic.
7. Activity Diagram 🚦
Activity Diagrams are essentially flowcharts for modeling the workflow of a system. They are useful for describing business processes or the logic within a use case.
- Initial Node: A solid circle indicating the start.
- Activity: Rounded rectangles representing a step in the process.
- Decision Node: Diamonds representing branching logic (Yes/No).
- Fork and Join: Thick horizontal bars used to model concurrency.
- Final Node: A circle with an inner dot indicating the end.
8. State Machine Diagram 🔁
State Machine Diagrams describe the behavior of a single object in response to internal and external events. They define the states an object can be in and the transitions between them.
- State: A condition during the life of an object where it satisfies a condition or performs an activity.
- Transition: An arrow connecting states, labeled with the event triggering the change.
- Guard Condition: Boolean expressions that must be true for a transition to occur.
- Entry/Exit Actions: Activities performed when entering or leaving a state.
Selecting the Right Diagram for the Task 🤔
One common mistake in software design is creating every possible diagram for every project. This leads to documentation bloat. Effective design requires selecting the diagrams that add the most value.
- Start with Use Case Diagrams: Understand what the system must do before worrying about how it does it.
- Define Structure with Class Diagrams: This is the core of object-oriented design. Ensure relationships are accurate before detailing behavior.
- Refine Logic with Sequence Diagrams: Use these to debug complex interactions identified in the class structure.
- Visualize Workflows with Activity Diagrams: Helpful for business logic that spans multiple classes.
- Map Infrastructure with Deployment Diagrams: Essential for system architects planning the environment.
Best Practices for Documentation 📝
Consistency is key when maintaining a UML model. Adhering to best practices ensures that diagrams remain useful over time.
- Standardize Naming Conventions: Use consistent naming for classes, attributes, and methods across all diagrams.
- Keep Diagrams Current: Outdated diagrams are worse than no diagrams. Update them whenever the code changes.
- Avoid Over-Detail: Do not include every single attribute in a class diagram. Focus on the ones relevant to the current context.
- Use White Space: Arrange elements logically to avoid overlapping lines. A cluttered diagram is hard to read.
- Version Control: Treat diagrams as code. Store them in version control systems to track history.
Common Pitfalls to Avoid ⚠️
Even experienced designers can fall into traps that reduce the value of UML.
- Diagram Sprawl: Creating too many diagrams that add no new information.
- Ignoring Context: Designing a component in isolation without considering how it fits into the larger system.
- Over-Engineering: Using complex patterns when simple ones suffice. Keep the design as simple as possible.
- Disconnected Models: Ensuring the design diagrams match the actual code implementation. Discrepancies here cause technical debt.
Integrating UML into Agile Workflows 🚀
UML is often associated with heavy, waterfall methodologies. However, it is equally valuable in Agile environments. The key is to adopt a “just-in-time” approach.
- Sketching: Use whiteboards or digital tools to sketch diagrams during planning sessions.
- Living Documentation: Maintain simplified diagrams that evolve with the sprint backlog.
- Focus on Value: Only create diagrams that help the team understand a requirement or solve a problem.
- Code as Source of Truth: In Agile, the code is the ultimate documentation. UML should support the code, not replace it.
Conclusion on Design Strategy
Mastering UML requires practice and discipline. It is a tool for thinking, not just drawing. By selecting the appropriate diagrams and maintaining them rigorously, teams can reduce misunderstandings and build robust software systems. The investment in clear modeling pays dividends in maintainability and scalability.
When starting a new project, do not feel pressured to fill pages with drawings. Start small. Identify the core classes. Map the primary interactions. Let the complexity grow organically as the project demands. This approach ensures that documentation remains a living asset rather than a bureaucratic burden.