In the complex architecture of modern software systems, understanding how components interact is critical for stability and performance. While sequence diagrams often take the spotlight for time-based interactions, Communication Diagrams offer a distinct perspective focused on object relationships and message flow. This guide explores how these diagrams visualize API handshakes in real-world scenarios, providing clarity for architects and developers alike.
When designing distributed systems, visualizing the contract between a client and a server is not merely documentation; it is a blueprint for reliability. By mapping out the specific messages exchanged during an API handshake, teams can identify potential bottlenecks, security vulnerabilities, and integration points before writing code. This approach ensures that the logical flow of data matches the physical transmission of requests.
🧠 Understanding the Communication Diagram Structure
A Communication Diagram, formerly known as a Collaboration Diagram in earlier versions of the Unified Modeling Language (UML), prioritizes the structural organization of objects over the strict chronological order found in sequence diagrams. In the context of API development, this means focusing on who is talking to whom and what data is being passed, rather than just the timing.
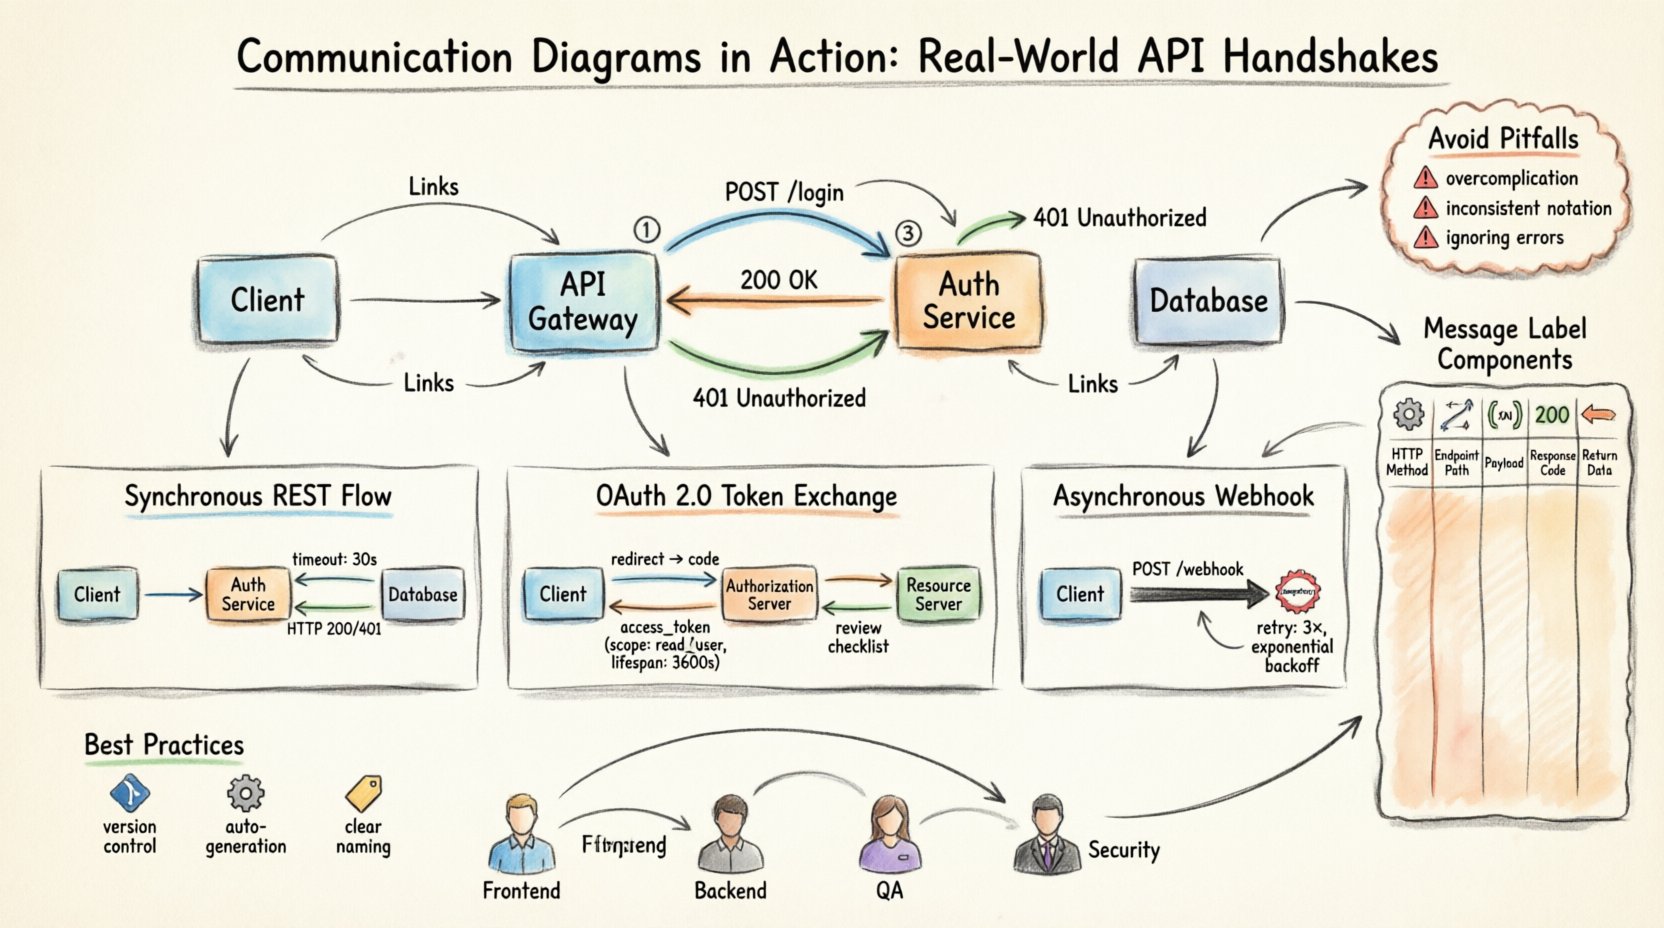
- Objects: Represented as boxes, these denote the distinct entities participating in the interaction. In an API context, these might include the Client, the API Gateway, the Authentication Service, and the Database.
- Links: The lines connecting objects represent the association or relationship path. For APIs, this indicates the network route or logical dependency.
- Messages: Arrows between objects denote the flow of information. These are labeled with the operation name, such as
POST /loginorGET /users. - Order Numbers: Small numbers placed near the arrows indicate the sequence of the interaction, ensuring the handshake logic is preserved.
Using this structure allows teams to see the topology of the integration. Instead of a vertical timeline, the diagram presents a map of dependencies. This is particularly useful for identifying circular dependencies or single points of failure in the communication path.
🔄 Example 1: Synchronous REST API Interaction
The most common interaction pattern is the synchronous Request-Response cycle. In this scenario, a client sends a request and waits for the server to process it before continuing. A Communication Diagram for this flow highlights the direct link between the initiating client and the target service.
Consider a standard authentication flow where a user submits credentials. The diagram would depict the following actors:
- User Interface: The frontend application collecting input.
- Authentication Service: The backend component validating credentials.
- Database: The storage layer verifying user records.
The message flow typically follows these steps:
- The User Interface initiates a
POST /loginmessage to the Authentication Service. - The Authentication Service forwards a query to the Database to retrieve user hashes.
- The Database returns the result to the Authentication Service.
- The Authentication Service processes the hash and returns a token to the User Interface.
Visualizing this on a Communication Diagram reveals the direct coupling between the Interface and the Service. If the Database is unavailable, the diagram makes it clear that the Service cannot complete its task, and the Interface will eventually timeout. This visibility helps in designing robust error handling strategies.
Key considerations for this diagram include:
- Timeout Values: The diagram should note the expected duration for the Database response to set appropriate client-side timeouts.
- Authentication Headers: The message labels should specify if headers like
Content-TypeorAuthorizationare part of the handshake. - Response Codes: Success (200) or Failure (401, 500) codes should be annotated on the return arrows.
🔐 Example 2: OAuth 2.0 Token Exchange
Security is a paramount concern in API design. The OAuth 2.0 protocol introduces a more complex handshake involving multiple entities. A Communication Diagram helps disentangle the flow of tokens and authorization codes without getting lost in the cryptographic details.
In this scenario, the actors expand to include an Authorization Server and a Resource Server. The flow is distinct because it involves a redirect and a token exchange step.
The interaction steps are visualized as follows:
- Step 1: The Client requests an authorization code from the Authorization Server via a redirect.
- Step 2: The user grants permission, and the server redirects back to the Client with the code.
- Step 3: The Client sends the code and client secrets to the Authorization Server to exchange for an Access Token.
- Step 4: The Authorization Server returns the Access Token.
- Step 5: The Client uses the Access Token to request data from the Resource Server.
Using a Communication Diagram for this flow emphasizes the trust relationships. The Resource Server does not talk directly to the Client for authentication; it trusts the Authorization Server. The diagram clearly shows the separation of duties.
Important details to capture in the diagram include:
- Token Lifespan: Indicate the validity period of the Access Token on the relevant message arrows.
- Scope: Specify the permission scope requested in the message label (e.g.,
read:profile). - Refresh Mechanism: Show the parallel flow where a Refresh Token is used to obtain a new Access Token without re-authenticating.
📬 Example 3: Asynchronous Webhook Notification
Not all API interactions require an immediate response. In event-driven architectures, services often notify others asynchronously. This is common in payment processing or inventory updates. A Communication Diagram for webhooks differs significantly because the return path is not immediate.
Here, the interaction is fire-and-forget from the initiator’s perspective. The diagram must clearly distinguish between the initial request and the subsequent callback.
The actors involved are:
- Initiating Service: The system triggering the event.
- Webhook Endpoint: The receiving service listening for the event.
The flow is depicted as:
- The Initiating Service sends a
POST /webhookmessage to the Webhook Endpoint. - The Webhook Endpoint acknowledges receipt (200 OK).
- The Initiating Service processes the event internally.
- Upon completion, the Initiating Service sends a callback to a secondary URL configured by the Webhook Endpoint.
This diagram highlights the statelessness of the initial request. The diagram makes it clear that the two services do not maintain a persistent connection for this specific transaction.
Best practices for visualizing asynchronous flows:
- Idempotency: Mark the message to indicate that the receiver should handle duplicate requests safely.
- Retry Logic: Annotate the return path to show the expected retry interval if the endpoint is unreachable.
- Signature Verification: Note that the message includes a cryptographic signature for verification.
📊 Visualizing Message Flow Components
To ensure clarity across different teams, standardizing the message labels is essential. The following table outlines the standard components that should be included in message labels within a Communication Diagram.
| Component | Description | Example |
|---|---|---|
| HTTP Method | The verb used to perform the action. | GET, POST, PUT |
| Endpoint Path | The specific resource being accessed. | /api/v1/users |
| Request Payload | The data structure sent in the body. | {"id": 123} |
| Response Code | The status indicating success or failure. | 200 OK, 404 Not Found |
| Return Data | The structure of the response body. | User Object |
🛠 Best Practices for Diagram Maintenance
A diagram is only useful if it remains accurate as the system evolves. Outdated diagrams can lead to integration failures and confusion during onboarding. Maintaining these diagrams requires discipline and integration into the development lifecycle.
- Version Control: Store diagram files alongside the API specification files. This ensures that changes in the code are reflected in the visual representation.
- Automated Generation: Where possible, use tools to generate diagrams from the API specification. This reduces manual errors and keeps the documentation in sync with the code.
- Review Cycles: Include diagram updates in the code review process. If an API endpoint changes, the diagram should be updated in the same pull request.
- Clear Naming: Use consistent naming conventions for objects and messages. Avoid abbreviations that might be unclear to new team members.
⚙️ Integrating Diagrams into Development Workflows
Integrating Communication Diagrams into the workflow does not have to be a heavy overhead. The goal is to reduce cognitive load and improve communication.
Consider the following integration points:
- Sprint Planning: Use the diagrams to discuss the scope of work. Ensure everyone agrees on the interaction model before development begins.
- Integration Testing: Base test cases on the message flows depicted in the diagram. This ensures all edge cases in the handshake are covered.
- Documentation Portals: Embed the diagrams in the public API documentation. This helps external developers understand the system architecture quickly.
- Incident Response: During an outage, the diagram serves as a quick reference to trace where the failure might have occurred in the chain.
📈 Evolving Diagrams with API Versioning
APIs rarely remain static. They evolve to meet new requirements, fix bugs, or improve performance. Communication Diagrams must evolve alongside the API versioning strategy.
When a new version is released, the diagram should reflect the changes clearly:
- Deprecation: Visually mark old endpoints that are no longer supported. This prevents clients from attempting to use legacy paths.
- New Paths: Clearly label new endpoints with their version number (e.g.,
/v2/users). - Breaking Changes: Highlight any changes in message structure or required parameters. This draws attention to potential compatibility issues.
By maintaining a history of diagram versions, teams can trace the evolution of the system. This historical context is invaluable when troubleshooting legacy issues or planning migrations.
🤝 Collaboration Between Teams
Communication Diagrams serve as a shared language between frontend, backend, and infrastructure teams. They bridge the gap between technical implementation and business logic.
- Frontend Developers: Use the diagram to understand the exact payload structure required for their requests.
- Backend Developers: Use the diagram to validate that their service exposes the correct endpoints and handles the expected load.
- QA Engineers: Use the diagram to define the test matrix for different interaction paths.
- Security Auditors: Use the diagram to review authentication flows and identify potential exposure points.
When all stakeholders refer to the same visual model, miscommunication is minimized. The diagram becomes the source of truth for how the system interacts.
🔍 Common Pitfalls to Avoid
Even with the best intentions, creating these diagrams can lead to common mistakes. Avoiding these pitfalls ensures the diagram remains a useful tool rather than a burden.
- Overcomplication: Do not include every single internal method call. Focus on the external boundaries and key service interactions.
- Inconsistent Notation: Ensure that arrows, labels, and object shapes follow the same style guide throughout the document.
- Lack of Context: Always include a legend or key that explains the symbols used, especially for custom message types.
- Ignoring Errors: Do not only diagram the happy path. Include error handling flows and timeout scenarios in the diagram.
- Static Documentation: Do not treat the diagram as a one-time artifact. It must be updated as the system changes.
🎯 Final Thoughts on API Visualization
Designing robust API handshakes requires more than just writing code; it requires a clear understanding of the flow of data and control. Communication Diagrams provide a powerful way to visualize these interactions, focusing on the relationships between services rather than just the sequence of events.
By adopting this visual approach, teams can identify issues earlier, communicate more effectively, and build systems that are easier to maintain and scale. The effort invested in creating and maintaining these diagrams pays dividends in reduced debugging time and clearer architectural decisions.
Remember that the goal is clarity. Whether you are dealing with synchronous REST calls, asynchronous webhooks, or complex token exchanges, a well-drawn Communication Diagram brings order to complexity.