Software architecture relies heavily on visual communication. When designing complex systems, teams must convey how objects interact, how messages flow, and where data transforms. The medium chosen for this visualization matters. The debate between using dedicated digital tools versus traditional sketches is not new, yet it remains relevant. Each method offers distinct advantages depending on the project phase, team size, and desired fidelity. This guide explores the mechanics of both approaches to help you decide which method serves your documentation needs best.
Understanding Communication Diagrams 🗣️
A communication diagram, often associated with UML (Unified Modeling Language), focuses on the interactions between objects or components within a system. Unlike sequence diagrams which emphasize time, communication diagrams prioritize the relationships and the flow of messages between structural elements. They are vital for developers to understand the logic of a module before writing code.
Creating these diagrams involves:
- Identifying Objects: Defining the entities participating in the interaction.
- Mapping Links: Drawing the connections that allow message passing.
- Labeling Messages: Specifying what data or commands are exchanged.
- Defining Multiplicity: Indicating how many instances of an object are involved.
Whether drawn on paper or a screen, the goal remains the same: clarity. However, the medium influences speed, accuracy, and longevity. Let us examine the two primary contenders in this architectural debate.
The Case for Traditional Sketches 📝
Before computers dominated the workspace, engineers used whiteboards and notebooks. This analog approach retains significant value in modern agile environments. The primary advantage lies in the reduction of friction. Sketching requires no login, no license, and no setup time.
Speed and Flow ⚡
When a team gathers to brainstorm a new feature, speed is essential. A whiteboard allows for rapid iteration. Ideas can be scribbled, erased, and redrawn in seconds. There is no mouse to click or layer to adjust. This fluidity encourages experimentation. Architects can explore multiple interaction paths without fear of “breaking” the file.
Accessibility and Inclusivity 🌍
Not every stakeholder has access to specialized software. In a hallway conversation or a quick stand-up, a sketch is universally accessible. Everyone understands pen and paper. This lowers the barrier to entry for non-technical stakeholders who might feel intimidated by complex modeling interfaces.
Focus on Logic over Aesthetics 🧠
Digital tools often tempt users to focus on alignment, colors, and shapes. Sketches force a focus on the logic itself. The lines are rough, the boxes are uneven, but the message flow is clear. This prevents the distraction of formatting and keeps the team concentrated on the system behavior.
Limitations of Sketching 📉
Despite the benefits, traditional methods have inherent weaknesses that cannot be ignored:
- Loss of Information: A whiteboard sketch is transient. If not photographed, the work disappears immediately.
- Versioning Issues: It is difficult to track changes over time. Did the interaction path change from Tuesday to Thursday? Hard to tell without a physical archive.
- Sharing Friction: To share a sketch, it must be scanned or photographed. This introduces quality loss and formatting errors.
- Collaboration Limits: Only a few people can draw on a physical board simultaneously. Remote teams cannot utilize this method effectively.
The Case for Digital Tools 💻
Digital diagramming platforms have evolved significantly. They offer structured environments where diagrams are treated as living documents. While setup time is higher, the long-term benefits for complex systems are substantial.
Version Control and History 📜
Digital files retain their history. Every change is logged, allowing teams to revert to previous states if a new design choice proves flawed. This audit trail is crucial for compliance and for understanding the evolution of the system architecture. You can see exactly when a specific interaction path was added or removed.
Integration and Automation 🤖
Modern tools often integrate with code repositories and project management systems. Diagrams can be linked to specific code modules, providing context directly within the IDE. Some platforms even support code generation, where the diagram acts as a blueprint for scaffolding boilerplate code. This bridges the gap between design and implementation.
Remote Collaboration 🌐
For distributed teams, digital tools are not just convenient; they are necessary. Multiple users can view and edit the same diagram simultaneously. Cursors appear in real-time, allowing for live brainstorming sessions across different time zones. This ensures that everyone is looking at the current state of the architecture.
Standardization and Reusability 🧩
Digital libraries allow teams to reuse standard components. A “User Interface” object or a “Database Connector” can be saved as a template. This ensures consistency across different diagrams within the same project. Teams can enforce naming conventions and styling rules automatically, maintaining a professional standard.
Limitations of Digital Tools 📉
The benefits come with costs that teams must manage:
- Cognitive Load: Learning a new interface takes time. Teams may spend more time configuring the tool than designing the system.
- Cost: Professional platforms often require subscriptions. Budget constraints can limit access to advanced features.
- Perfectionism: The ease of formatting can lead to over-polishing. Teams may spend hours aligning boxes instead of solving architectural problems.
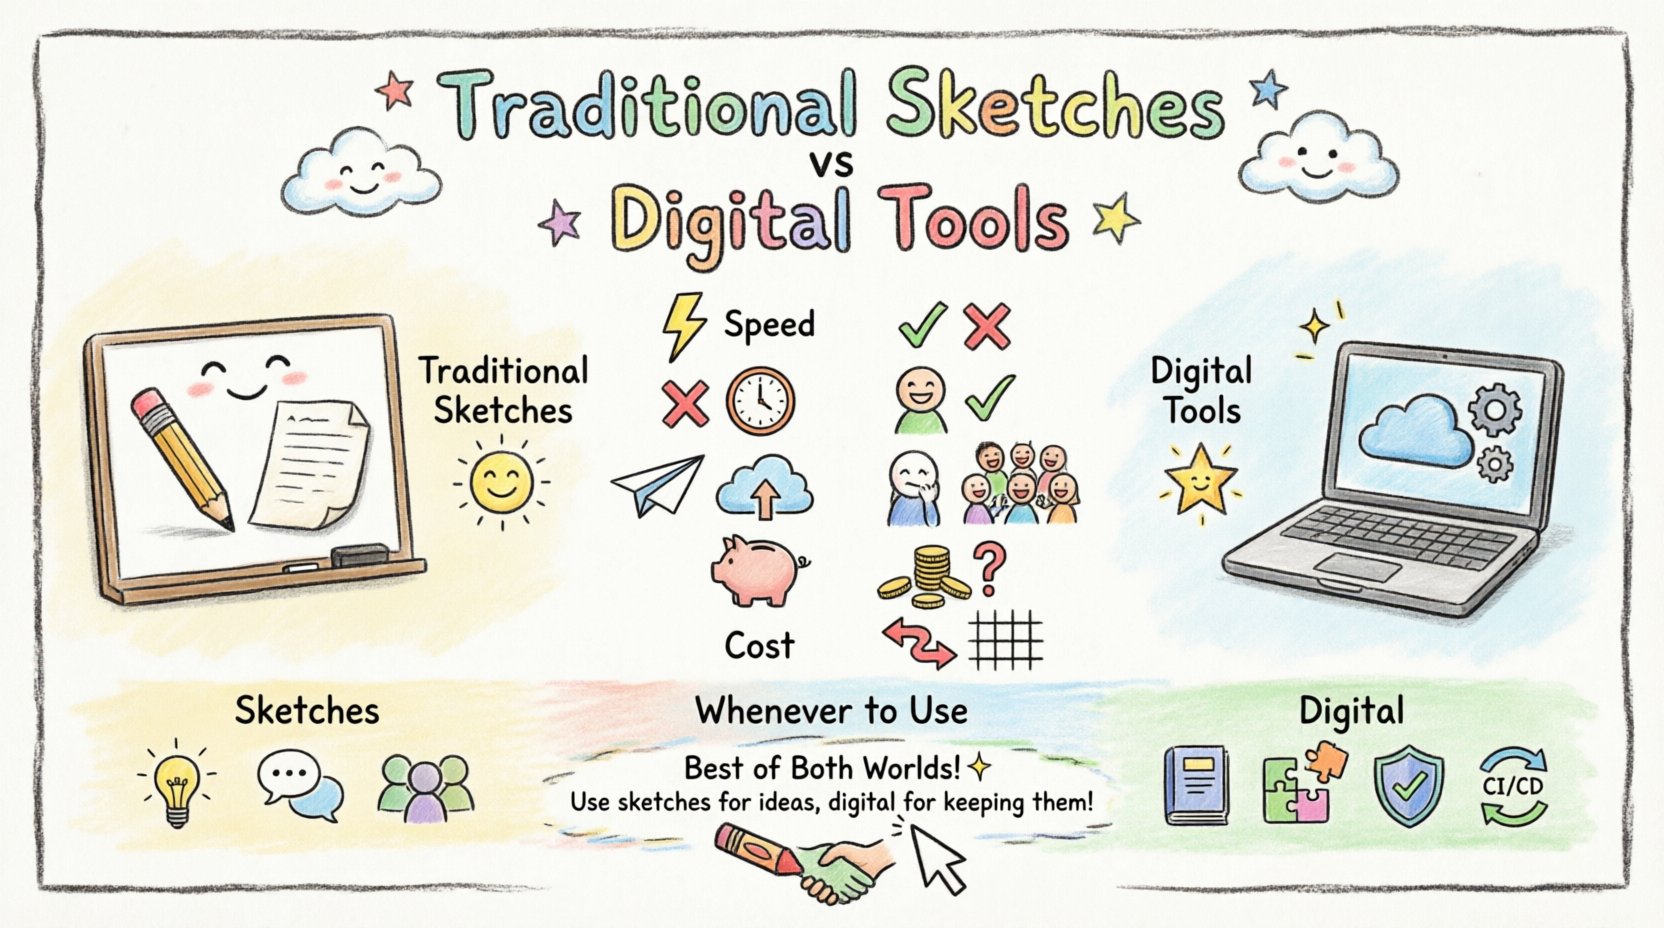
Comparative Analysis: Key Differences 📊
To visualize the trade-offs, we can compare the two methods across several critical dimensions. This table highlights where each method excels and where it falls short.
| Feature | Traditional Sketches | Digital Tools |
|---|---|---|
| Setup Time | Instant | Minutes to Hours |
| Versioning | Manual / None | Automatic / Detailed |
| Sharing | Physical / Photo | Link / Cloud Sync |
| Remote Access | Low | High |
| Fidelity | Low / Rough | High / Precise |
| Cost | Low / Free | Variable / Subscription |
| Longevity | Low | High |
| Flexibility | High | Medium |
When to Choose Sketching 🧭
There are specific scenarios where traditional sketches outperform digital solutions. Recognizing these moments prevents wasted effort and maintains momentum.
Initial Brainstorming Sessions 🧠
During the earliest stages of a project, ideas are fluid. You might be exploring ten different interaction patterns. Sketching allows you to discard ten bad ideas without leaving digital traces. The mental model is the priority, not the artifact.
Quick Clarifications 🗣️
If a developer asks, “How does the payment service talk to the inventory?” a quick sketch on a napkin or whiteboard resolves the confusion immediately. Waiting to open software creates a bottleneck. Speed wins in these micro-interactions.
Workshops and Training 🎓
When teaching architecture concepts, digital tools can feel rigid. Drawing on a board engages the audience physically. It creates a shared focal point. This is particularly effective for onboarding new team members who need to understand the system flow.
When to Choose Digital Tools 🛠️
Digital platforms become the superior choice as the project matures and complexity increases. They are essential for documentation that must survive the lifecycle of the software.
Production Documentation 📚
Once a design is finalized, it becomes a reference for the entire team. Digital diagrams can be embedded in wikis, README files, and release notes. They remain accessible even years after the initial design phase.
Complex Systems 🏗️
As the number of objects grows, sketches become unreadable. A system with hundreds of interacting components requires the zoom and pan capabilities of digital software. You can collapse complex groups to see the high-level view, then expand for details.
Regulatory Compliance ✅
Certain industries require strict documentation trails. Digital tools provide metadata, timestamps, and author information automatically. This satisfies audit requirements that handwritten notes cannot meet.
Continuous Integration 🔄
When diagrams are part of the codebase, they must be version-controlled. Digital tools integrate with Git. Changes to the architecture are committed alongside code changes. This ensures the documentation never drifts from the implementation.
Maintaining Documentation Integrity 🔄
Regardless of the tool chosen, the biggest risk to communication diagrams is obsolescence. Code changes, but the diagram often remains static. This creates a “documentation debt” where the drawing no longer reflects reality.
Syncing with Code
Teams should establish a rule: if the code changes, the diagram changes. In digital environments, this is easier to automate. Annotations can be linked to specific functions. In sketch environments, this requires a conscious effort to update physical records or photos.
Ownership and Maintenance
Who is responsible for keeping the diagram accurate? Assigning this role prevents the “everyone thought someone else would do it” scenario. For sketches, the owner might be the person who drew it. For digital tools, it is often a designated architect or lead developer.
Common Pitfalls to Avoid ⚠️
Both methods suffer from similar human errors. Being aware of these traps helps maintain the quality of the visualization.
- Over-Engineering: Creating diagrams that look perfect but add no value. Focus on the message flow, not the box shape.
- Ignoring the Audience: Creating a diagram for a machine instead of a human. Avoid technical jargon if the audience is product management.
- Lack of Context: A communication diagram should not exist in isolation. It needs a legend or a reference to the system context.
- Stagnation: Never update a diagram. If the system evolves, the drawing must evolve with it.
Frequently Asked Questions ❓
Can I mix both methods?
Absolutely. Many teams sketch the initial concept, then migrate the finalized version to a digital tool. This combines the speed of brainstorming with the durability of digital storage.
Do sketches count as formal documentation?
In most agile frameworks, sketches are accepted as temporary documentation. However, for legal or compliance purposes, digital records are usually required.
What if the team is fully remote?
Digital tools are mandatory in this scenario. Whiteboards with remote access capabilities exist, but native digital platforms offer better integration.
Is UML required for communication diagrams?
No. While UML provides a standard, the communication diagram is a concept. You can draw it using simple boxes and arrows without strict UML syntax, provided the team agrees on the notation.
How do I handle diagram clutter?
Use grouping and nesting. Break a large diagram into smaller subsystems. Digital tools make this easy with sub-diagrams or linked views.
Final Considerations 🏁
The choice between communication diagram tools and traditional sketches is not binary. It is a spectrum of trade-offs. Sketches offer speed and human connection. Digital tools offer precision and permanence. The best architects know when to pick up a marker and when to open the software. They understand that the tool is secondary to the clarity of the message. By balancing the immediacy of the sketch with the power of the digital platform, teams can create documentation that is both accurate and useful.
Ultimately, the goal is to reduce ambiguity in the system design. Whether on a whiteboard or a cloud server, if the diagram helps the team build the right software, it has served its purpose. Evaluate your current workflow, identify the bottlenecks, and select the method that aligns with your team’s pace and needs.