Now Reading: Analyzing Meal-Kit Market Dynamics with the Best AI-Powered Infographic Maker
-
01
Analyzing Meal-Kit Market Dynamics with the Best AI-Powered Infographic Maker


Analyzing Meal-Kit Market Dynamics with the Best AI-Powered Infographic Maker
Developing a successful business strategy requires a deep understanding of multiple variables, and finding the best AI-powered infographic maker is the first step toward achieving that clarity. In a competitive landscape like the meal-kit delivery industry, visualizing your data is not just a luxury; it is a necessity for strategic planning. Visual Paradigm’s Eight Aspects Infographic Designer is a professional application designed to transform complex topics into structured, visually engaging eight-part analyses. By using artificial intelligence to bridge the gap between raw data and professional design, this tool ensures that your strategic insights are presented with precision and authority.
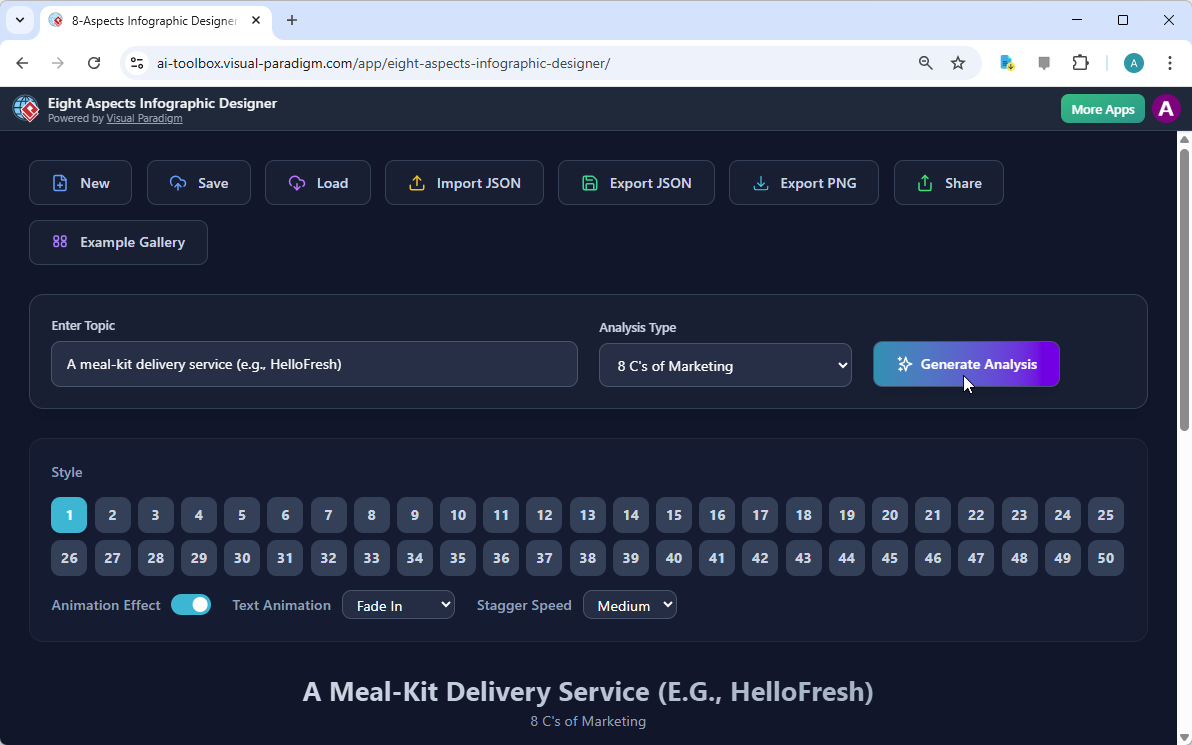
In the initial phase of any project, the designer must define the scope and the analytical framework. Image 1 displays the landing screen of the Eight Aspects Infographic Designer, showing a user-friendly interface where the process begins. The user provides a brief description, such as “A meal-kit delivery service (e.g., HelloFresh),” and selects a specific framework from the “Analysis Type” dropdown menu. In this instance, the user has chosen the “8 C’s of Marketing,” a comprehensive model for evaluating market positioning. The layout is clean, featuring essential navigation buttons like New, Save, Load, and Share at the top, ensuring a smooth workflow from the very first click.
Strategic Frameworks and AI-Driven Content Creation
The core strength of this online infographic tool lies in its ability to generate content-rich visuals based on minimal input. When you click the “Generate Analysis” button, the AI examines your topic and populates eight distinct sections with relevant data points. This feature is particularly valuable for business analysts and strategists who need to create comprehensive reports without spending hours on manual data entry. The AI acts as a digital consultant, suggesting plausible and relevant content for frameworks such as SWOT, PESTLE, Kotter’s 8-Step Change Model, and Porter’s Five Forces.
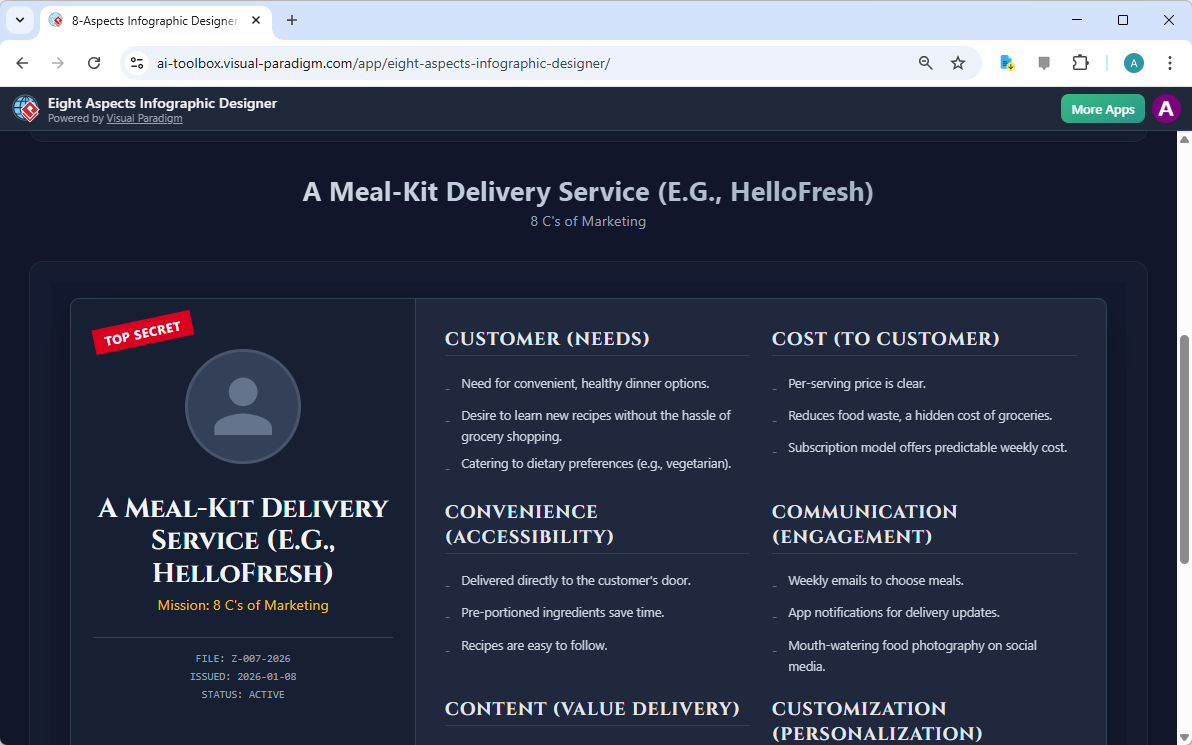
As shown in Image 2, the result is a sophisticated infographic that breaks down the meal-kit delivery service into eight essential “C’s”: Customer (Needs), Cost (To Customer), Convenience (Accessibility), Communication (Engagement), Content (Value Delivery), Customization (Personalization), and other critical marketing dimensions. The design is structured as a professional report, even featuring a “TOP SECRET” visual element for a thematic touch. The professional infographic editor allows users to select from 50 different styles, ranging from corporate and minimalist to creative and bold, ensuring the final output aligns perfectly with the intended audience.
Key Takeaways for Effective Visual Analysis
-
Accelerate Strategic Planning: Move from a blank page to a full analysis in seconds using AI generation.
-
Comprehensive Coverage: Ensure all eight dimensions of your chosen framework are addressed without oversight.
-
Versatile Framework Library: Access pre-defined models like SWOT, PESTLE, and Kotter’s 8 Steps instantly.
-
Dynamic Presentation: Utilize text animations and high-quality layouts to keep your audience engaged.
-
Cloud-Based Efficiency: Save, load, and manage your projects from any device with an internet connection.
Customizing Your Narrative for Maximum Impact
While the AI provides a robust starting point, the Eight Aspects Infographic Designer offers full creative control over the final message. Users can click directly into any text field to refine the AI-generated points or add specific data from their own research. This easy-to-use infographic app is built on the principle of flexibility, allowing for inline content editing that is both intuitive and efficient. You can adjust the “Mission” text, update the status of the report, and fine-tune every bullet point to ensure total accuracy before finalizing the design.
Beyond text editing, the application provides advanced layout controls. You can cycle through different visual arrangements to see which one highlights your data most effectively. Additionally, the tool features “Animation Effects” that can be toggled on or off. You can select “Text Animation” styles like “Fade In” or “Slide Up” and adjust the “Stagger Speed” to “Slow,” “Medium,” or “Fast.” These technical touches transform a static image into a dynamic presentation piece, making it ideal for consultants who need to present their findings to stakeholders in a memorable way.
Seamless Collaboration and Sharing Features
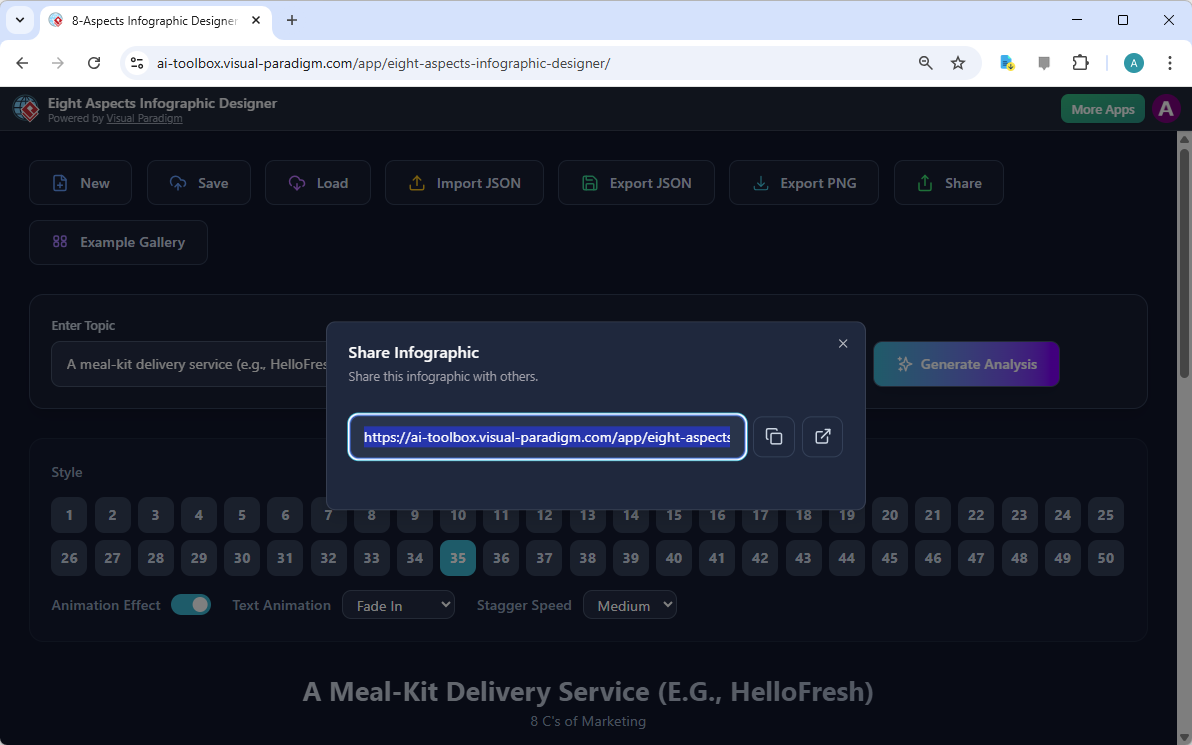
In a modern professional environment, the ability to collaborate and share work instantly is paramount. Once your analysis is complete and saved to the cloud, the application provides a streamlined sharing process. Image 3 illustrates the “Share Infographic” modal, which generates a unique URL for your project. By copying this link, you can send your work to colleagues or clients, who can then view the infographic in a dedicated “Viewer Mode.” This mode hides all editing controls, presenting a polished, interactive version of your work that is perfect for remote presentations.
This professional analysis software also recognizes the need for offline backups and local management. Users can export their projects as JSON files for privacy or local storage, and they can also export the final design as a PNG image for inclusion in traditional reports or slide decks. If you prefer physical documentation, the output is optimized for printing directly from your browser, allowing you to generate high-quality PDFs or hard copies with a simple keyboard shortcut. This range of export options ensures that your visual insights are accessible whenever and wherever they are needed.
Advanced Analysis Types for Every Professional Need
The Eight Aspects Infographic Designer is not limited to marketing models. Project managers can use “Kotter’s 8-Step Change Model” to outline organizational transitions, while researchers can use comparison frameworks to contrast different topics. The structured nature of the eight-aspect layout forces a balanced perspective, preventing the user from focusing too heavily on one area while neglecting others. Whether you are conducting a PESTLE analysis to understand external market factors or using Porter’s Five Forces to assess competitive intensity, the application provides the technical structure required for a deep, holistic view of the subject matter.
Conclusion: Elevate Your Business Insights
Visualizing complex strategies no longer requires hours of design work or advanced technical skills. By leveraging the best AI-powered infographic maker, you can turn a simple topic description into a comprehensive, professional-grade analysis in minutes. Visual Paradigm Online’s Eight Aspects Infographic Designer combines the power of generative AI with a highly customizable editing suite, making it the ideal tool for business analysts, project managers, and consultants who value both speed and precision. Whether you are mapping out a meal-kit delivery strategy or managing a large-scale corporate change, this tool ensures your message is clear, structured, and impactful.
Are you ready to transform your data into a stunning visual narrative? Visit the Eight Aspects Infographic Designer today and experience how easy it is to generate high-level strategic insights with the click of a button.
Try the Eight Aspects Infographic Designer now: Launch Tool
Learn more about our AI-powered features: Explore Details
Related Links
-
Visual Paradigm 8-Aspects Infographic Designer Features: Explore the comprehensive features of Visual Paradigm’s 8-aspects infographic designer for creating structured professional diagrams.
-
AI-Powered 8-Aspects Infographic Designer Tool: Utilize advanced AI-driven tools to generate and customize 8-aspects infographics with efficiency and precision.
-
Release Notes: AI 8-Aspect Infographic Designer: Stay informed about the latest software updates and release notes for the AI-powered 8-aspect infographic design platform.
-
Understanding Kotter’s 8-Step Change Model: Learn about the eight essential steps defined by John Kotter for leading and sustaining successful organizational change.