Designing robust API architectures requires more than just writing code; it demands a clear understanding of how components interact. A communication diagram serves as a critical map for these interactions, highlighting the flow of data and control between objects or services. Without a comprehensive checklist, developers risk overlooking critical paths, leading to fragile systems that are difficult to maintain. This guide provides a rigorous framework for validating your communication diagrams, ensuring every connection, message, and state is accounted for. 🛠️
When architects and developers collaborate, visual documentation bridges the gap between abstract requirements and concrete implementation. A well-crafted diagram clarifies dependencies, reduces ambiguity, and accelerates onboarding for new team members. By adhering to a strict checklist, you ensure that the architecture is not only functional but also visible and understandable to all stakeholders. Let us explore the essential elements required for complete architectural visibility.
Understanding the Communication Diagram in API Design 🤔
A communication diagram, often used within the Unified Modeling Language (UML), focuses on the organization of objects and the messages passed between them. Unlike sequence diagrams, which emphasize time ordering, communication diagrams highlight the structural relationships. In the context of API architecture, this distinction is vital. You need to know not just when a request happens, but which service is responsible for handling it and how it connects to downstream dependencies.
Visibility is the core goal here. If a diagram cannot be read by a senior engineer in ten minutes, it fails its purpose. The checklist below is designed to enforce clarity. It moves beyond basic syntax to address semantic completeness. We are looking for a representation that matches the actual runtime behavior of the system. This alignment prevents the common pitfall where documentation diverges from code.
Participant Inventory: Identifying Every Actor 🏗️
The foundation of any communication diagram is the participant. A participant represents an object, service, or module that plays a role in the interaction. In an API ecosystem, these are typically REST endpoints, microservices, external gateways, or database layers.
- Internal Services: Ensure every internal service involved in the transaction is explicitly named. Avoid generic labels like “Service A.” Use domain-specific names such as “Order Processing Service” to provide context.
- External Integrations: Map all third-party APIs. This includes payment gateways, email providers, and authentication servers. If an external dependency is optional, indicate this clearly in the diagram.
- Client Interfaces: Define the entry points. Is this a mobile app, a web frontend, or a server-to-server integration? The client type influences security requirements and payload structures.
- Data Stores: While often abstracted, the database or cache layer is a participant in the data flow. Ensure read and write paths are represented if they involve complex transactions.
Missing a participant is a critical failure in visibility. If a service is not drawn, it implies it does not exist, yet it may be essential for the system to function. Verify the inventory against the codebase or service registry to ensure no hidden dependencies are omitted.
Mapping Connections and Links 🔗
Links represent the associations between participants. They define the paths over which messages travel. In API architecture, these links correspond to network connections, API endpoints, or internal method calls.
- Link Directionality: Clearly mark arrows to show the direction of the initial request and the return response. Bidirectional communication should be represented with two arrows or a specific notation.
- Protocol Indication: While the diagram abstracts implementation, knowing the protocol helps. Is this HTTP/REST, gRPC, or a message queue event? Label the link if the protocol dictates specific behavior.
- Dependency Strength: Distinguish between synchronous and asynchronous links. Synchronous links imply a blocking wait, whereas asynchronous links imply fire-and-forget or callback mechanisms. This distinction affects latency and reliability strategies.
- Critical Paths: Identify the primary flow. Use thicker lines or distinct colors to highlight the happy path versus fallback routes. This helps reviewers quickly grasp the standard operation.
Every link must have a purpose. A line without a message flowing through it is noise. If a link exists solely for configuration or health checks, it should be noted as such or excluded to reduce clutter. Keep the diagram focused on the operational flow.
Message Flow Logic and Sequence ⏱️
While communication diagrams do not strictly enforce a time axis, the sequence of messages is crucial for understanding the logic. You must ensure the order of operations is logical and traceable.
- Message Identification: Each message should have a unique identifier or a clear name, such as “Create Order” or “Fetch User Profile.” This aids in cross-referencing with API specification documents.
- Call and Return: Explicitly show the request and the corresponding response. Do not assume the response is implied. A missing return arrow can imply a fire-and-forget operation, which changes the contract.
- Conditional Logic: Branching paths are common in APIs. Use notation to indicate if a message is sent based on a condition. For example, “If validation fails, send Error Response.”
- Looping and Iteration: If a service processes a batch of items, indicate the loop. This clarifies that the interaction is not a single event but a recurring pattern.
Sequence errors are a leading cause of integration failures. If the diagram suggests a response before a request is fully processed, the documentation is misleading. Validate the flow against the actual implementation logic to ensure temporal consistency.
Data Structures and Payloads 💾
A communication diagram is not just about control flow; it is about data flow. Understanding what moves between services is as important as knowing who sends it.
- Payload Labels: Where possible, annotate messages with the type of data being transferred. Use terms like “JSON Payload” or “Binary Stream.” This sets expectations for consumers.
- Schema References: Link the diagram to the data schema definition. If a message contains a complex object, reference the specific schema file or interface definition. This ensures type safety.
- Transformation Points: If data is transformed between services (e.g., DTO mapping), mark this on the link. It indicates a point of potential data loss or conversion error.
- Volume and Frequency: Indicate if the message is high-volume or low-volume. This informs architectural decisions regarding caching and buffering.
Ignoring data structure leads to brittle integrations. A service might expect a string, but the diagram shows an object. Such discrepancies only become apparent during testing. Ensure the diagram reflects the contract.
Error Handling and Exception Paths ⚠️
A complete diagram must account for failure. Systems rarely run without errors, and the documentation should reflect how the system behaves when things go wrong.
- Timeout Handling: Show what happens if a service does not respond within the expected timeframe. Is there a retry mechanism? Is the request abandoned?
- Error Codes: Indicate the specific error responses returned. Instead of “Error,” specify “404 Not Found” or “503 Service Unavailable.”
- Fallback Mechanisms: If a primary service fails, is there a secondary path? Draw this alternative flow. This is crucial for high-availability architectures.
- Dead Letter Queues: For asynchronous systems, show where failed messages are routed. This ensures no data is lost silently.
Visualizing errors improves system resilience. It forces the team to consider edge cases during the design phase rather than reacting to them in production.
Authentication and Security Flows 🔒
Security is not an afterthought; it is a structural component of the architecture. The diagram should reveal how identity and access are managed.
- Token Exchange: Show where tokens are issued and validated. Does the client request a token from an auth service before calling the API?
- Encryption Points: Indicate where data is encrypted. Is it encrypted in transit (TLS) or at rest? Mark sensitive data flows clearly.
- Access Control: Highlight where authorization checks occur. Is it done at the gateway or within the service itself?
- Secret Management: While secrets themselves are not drawn, the flow of credentials should be implied. Avoid hardcoding sensitive data in the diagram, but indicate the need for secure injection.
Security visibility helps auditors and developers quickly identify potential vulnerabilities. If a data flow bypasses an authentication step in the diagram, it is a red flag.
Maintenance and Version Control 🔄
Diagrams are living documents. They must evolve as the system changes. A checklist for maintenance ensures the diagram remains accurate over time.
- Versioning Strategy: Indicate which version of the API the diagram represents. APIs change, and the diagram must reflect the current state.
- Change Tracking: When a link is added or removed, update the diagram immediately. Do not rely on memory.
- Review Cycles: Schedule regular reviews of the diagrams. Are there deprecated services still shown? Are there new dependencies missing?
- Documentation Links: Embed links to the diagram file in the project repository. This ensures it is part of the source of truth.
Outdated diagrams are worse than no diagrams. They create false confidence. Treat the diagram as code: it must be versioned, reviewed, and tested against reality.
Common Mistakes to Avoid ❌
Even with a checklist, errors can creep in. Being aware of common pitfalls helps you avoid them.
- Overcomplication: Do not draw every single internal method call. Focus on the service boundaries. Too much detail obscures the big picture.
- Ignoring Asynchronicity: Assuming all calls are blocking leads to poor performance modeling. Clearly mark background tasks.
- Missing Feedback Loops: Systems often have confirmation steps. Ensure the user or system receives confirmation of an action.
- Unclear Labels: Ambiguous labels like “Process” or “Handle” are useless. Be specific about the action.
Integration with Workflow 🛠️
Finally, the diagram must integrate into the development workflow. It should not be a static artifact created once and forgotten.
- Design Reviews: Include the diagram in architecture review meetings. It serves as the focal point for discussion.
- Onboarding: Use the diagram as the first document for new engineers. It provides context faster than reading code.
- Testing Plans: Derive test cases from the diagram. Every message flow should have a corresponding integration test.
- Monitoring: Map the diagram to monitoring dashboards. If a link fails, the diagram helps locate the source of the issue.
When the diagram is part of the workflow, it gains value. It becomes a tool for development, not just a deliverable for documentation.
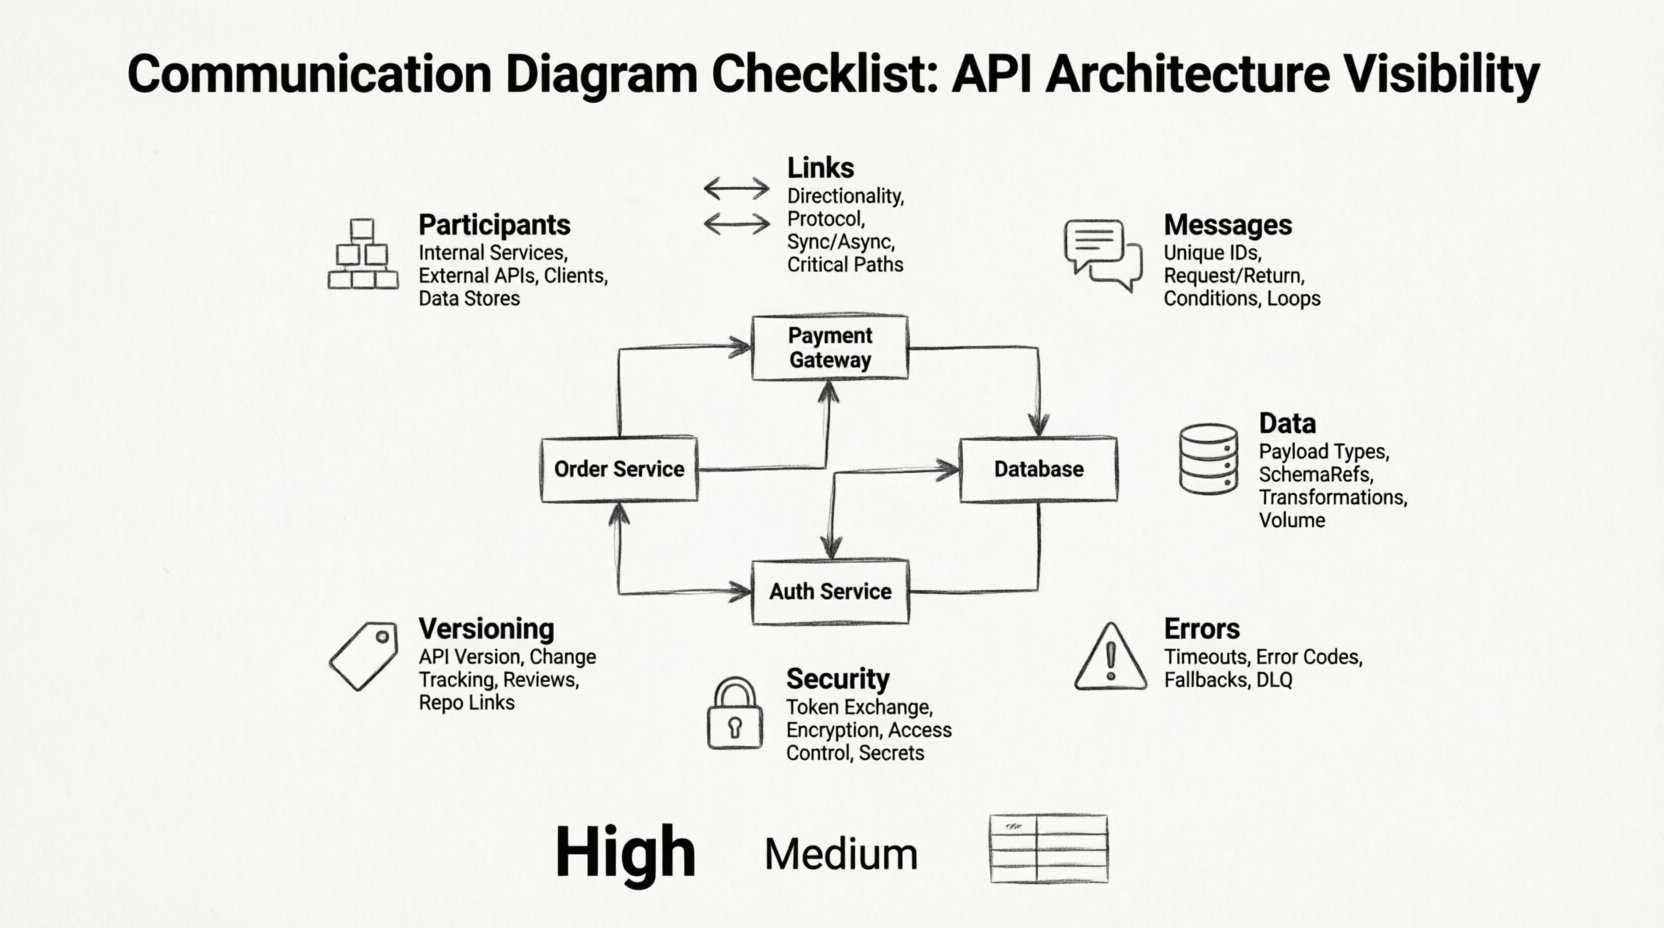
The Master Communication Diagram Checklist 📝
Use the following table to validate your diagrams before finalizing them. This summary consolidates the requirements discussed above.
| Category | Check Item | Priority |
|---|---|---|
| Participants | Are all services named with domain-specific terms? | High |
| Links | Are directions and protocols clearly marked? | High |
| Messages | Are request and return arrows explicit? | Medium |
| Data | Are payload types and schema references noted? | Medium |
| Errors | Are error paths and fallbacks included? | High |
| Security | Is authentication flow visible? | High |
| Versioning | Is the API version indicated? | Medium |
Completing this table ensures that no aspect of the architecture is left undocumented. It provides a tangible artifact for project managers and engineers to verify readiness.
Final Thoughts on Architectural Visibility 🌟
Creating a communication diagram is an exercise in clarity. It forces you to confront the complexity of your system and organize it into a digestible format. By following this checklist, you ensure that the diagram is not merely a drawing but a precise specification of your API architecture.
Visibility leads to better decisions. When the flow of data is clear, bottlenecks are easier to spot, security risks are easier to mitigate, and onboarding is faster. Take the time to validate your diagrams against this checklist. The effort invested in documentation pays dividends in system stability and team efficiency.
Remember, the goal is not perfection but accuracy. A diagram that is 90% accurate and regularly updated is better than a perfect one that is never touched. Keep the workflow simple, keep the documentation current, and maintain the visibility your architecture deserves.