


If you’ve ever spent hours manually drawing nodes, artifacts, and connections for a UML deployment diagram—only to realize you missed a firewall, mislabeled a cloud service, or forgot to model high availability—then you know how time-consuming and error-prone traditional modeling can be.
But what if you could describe your system in plain English and get a fully compliant, visually clean, UML deployment diagram in seconds?
Enter Visual Paradigm’s AI-powered tools, which are transforming how architects, developers, and teams design and document the physical runtime architecture of modern software systems—especially in cloud, distributed, and microservices environments.

Let’s walk through how AI integration in Visual Paradigm is not just making deployment diagrams easier to create—but dramatically reducing cost, accelerating delivery, and boosting team productivity.
🔍 What Is a UML Deployment Diagram? (And Why It Matters)
A UML Deployment Diagram is a structural diagram that visualizes the physical architecture of a software system at runtime. It shows:
-
Where components run (on servers, containers, devices),
-
How they’re connected (via networks, protocols),
-
Which software artifacts are deployed where,
-
And how infrastructure elements like firewalls, load balancers, and databases fit into the picture.
✅ Use Case: Ideal for cloud-native apps, client-server systems, embedded devices, or hybrid on-premise/cloud deployments.
For a full foundation, check out this comprehensive guide to UML deployment diagrams—it breaks down every element, from nodes and artifacts to deployment relationships and communication paths.
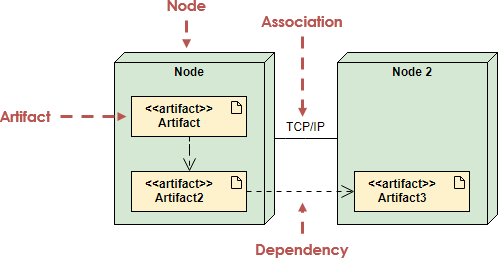
🧩 Key Elements of a Deployment Diagram (and How to Model Them Right)
Here’s what you’ll typically see in a well-structured deployment diagram:
| Element | Description | Stereotype Example |
|---|---|---|
| Node | A physical or logical computational resource (e.g., server, device, VM, container) | <<server>>, <<cloud>>, <<container>> |
| Artifact | A software component deployed on a node (e.g., .jar, .exe, config file) |
<<artifact>> or <<library>> |
| Deployment Relationship | Shows where an artifact runs | Dashed arrow with <<deploy>> stereotype |
| Communication Link | Physical or logical connection between nodes | Solid line with protocol (e.g., <<TCP/IP>>, <<HTTPS>>) |
| Nested Nodes | Hierarchies like containers inside VMs, or Kubernetes clusters inside AWS EC2 instances | Use nesting for clarity |
💡 Pro Tip: Always use stereotypes like
<<server>>,<<device>>,<<executionEnvironment>>, or<<cloud>>to make your diagrams instantly readable and standardized.
For a deep dive into best practices, including how to model complex hierarchies and avoid common mistakes, refer to this beginner’s guide to deployment diagrams using Visual Paradigm Online.
⚙️ Why Manual Modeling Is a Drag (And How AI Fixes It)
Imagine this scenario:
You’re designing a cloud-based e-commerce platform. You need to show:
EC2 instances hosting web services,
AWS Lambda for event processing,
DynamoDB for data storage,
S3 for file storage,
An Application Load Balancer,
And a firewall for security.
Traditionally, you’d spend hours:
-
Dragging and dropping nodes,
-
Connecting them with the right protocols,
-
Adding artifacts,
-
Applying stereotypes,
-
Aligning everything neatly.
Now, with Visual Paradigm’s AI Diagram Generator, you can simply say:
“Create a UML deployment diagram for an AWS-based e-commerce system with EC2 web servers, Lambda functions, DynamoDB, S3, and a load balancer.”
✅ In seconds, the AI generates a fully compliant, UML-standard diagram—complete with:
-
Correct node types (
<<server>>,<<cloud>>), -
Proper deployment relationships,
-
Communication links with
<<HTTPS>>and<<TCP/IP>>labels, -
And even auto-suggestions for best practices (e.g., “Consider multi-region replication for high availability”).
This is not just faster—it’s smarter.
🔗 Learn how to generate such diagrams with AI: How to Create a UML Deployment Diagram for Cloud Apps with AI
🤖 The Power of AI: From Draft to Design in Conversational Mode
Visual Paradigm’s AI Chatbot (available at chat.visual-paradigm.com) turns modeling into a natural conversation.
Try these commands:
-
“Add a firewall between the public web tier and the internal database.”
-
“Make DynamoDB multi-region for failover and high availability.”
-
“Show Kubernetes clusters running inside EC2 instances.”
-
“Replace the monolithic server with Docker containers.”
Each prompt updates the diagram instantly—no redrawing, no repositioning. The AI understands context and applies UML rules automatically.
✅ This means iterative design becomes effortless. You can explore architecture options in real time—cloud vs. on-premise, monolith vs. microservices, single vs. multi-region—without getting bogged down in tooling.
🔗 Explore how this works: Comprehensive Tutorial on Deployment Diagrams with Visual Paradigm
💼 Real-World Impact: How AI Saves Time, Money, and Mistakes
Let’s break down the tangible benefits:
🕒 Time Savings: From Days to Seconds
-
Manual creation: 2–5 hours for a medium-complexity cloud architecture.
-
AI generation: Under 30 seconds.
-
That’s up to 95% faster—and you’re not just saving time, you’re accelerating decision-making.
💰 Cost Reduction: Less Labor, Fewer Errors
-
Less time spent on repetitive diagramming = lower labor costs.
-
AI enforces UML standards and suggests best practices (e.g., “Add a reverse proxy for security”).
-
Fewer design flaws = less rework and fewer costly deployment failures.
🔗 See how AI reduces errors and rework: Deployment Diagram Features in Visual Paradigm Software
🚀 Faster Prototyping & Better Decisions
-
Rapidly compare architectures: “What if we moved to Azure instead of AWS?”
-
Evaluate scalability: “How would adding a second load balancer affect performance?”
-
Validate security: “Where should we place the WAF?”
This kind of rapid experimentation was once impossible without a full team and weeks of planning.
🔗 Try it yourself: Free Deployment Diagram Tool – Visual Paradigm Online (No install required!)
🛠️ Advanced Features That Make AI Work Even Better
Visual Paradigm doesn’t stop at AI generation. It integrates seamlessly with other tools and workflows:
-
PlantUML Integration: Use PlantUML syntax to define your deployment model in code, then visualize it instantly in the UI.
-
Cross-Model Linking: Connect your deployment diagram to component diagrams, C4 models, or ArchiMate frameworks for end-to-end architecture documentation.
-
Real-Time Collaboration: Share diagrams and chat histories with your team—perfect for distributed or global teams.
-
Export & Share: Export to PDF, PNG, SVG, or HTML for reports, presentations, or documentation.
🔗 Dive into the full feature set: Visual Paradigm User Guide: Creating Deployment Diagrams
🧠 Pro Tips for Creating High-Impact Deployment Diagrams
Here’s how to get the most from your AI-generated diagrams:
-
Start with Purpose
Ask: What deployment concerns matter most? (e.g., scalability, security, failover). Focus only on architecturally significant elements. -
Use Stereotypes Liberally
<<server>>,<<container>>,<<cloud>>,<<device>>—they make your diagrams instantly understandable. -
Model Nesting Clearly
Show containers inside VMs, VMs inside physical servers, or Kubernetes clusters inside cloud regions. -
Keep It Layered
Use packages to group nodes by environment (e.g., “Production,” “Staging”) or layer (e.g., “Frontend,” “Backend”). -
Validate Against Requirements
Use the AI to check: Is this system resilient? Is it secure? Can it scale? Then refine.
🔗 Learn step-by-step: How to Draw a Deployment Diagram in UML: Step-by-Step Tutorial
🎯 Final Thoughts: From Manual Drawing to Intelligent Design
Gone are the days when deployment diagrams were just a box-and-arrow exercise. With Visual Paradigm’s AI-powered tools, they’ve become:
-
Dynamic (you can evolve them conversationally),
-
Intelligent (they suggest best practices),
-
Collaborative (teams can co-create and share),
-
And cost-effective (saving time, reducing errors, accelerating delivery).
Whether you’re designing a microservices architecture on AWS, a secure IoT system, or a hybrid cloud platform, AI in Visual Paradigm turns deployment modeling from a chore into a strategic advantage.
✅ Ready to Get Started?
Don’t just model your system—design it smarter.
👉 Start your journey today:
-
Use the AI Chatbot to generate diagrams in plain English.
-
Try the free online tool—no installation needed.
-
Or download the full Visual Paradigm desktop edition with an active license for advanced features.
📌 Summary: Why AI + Visual Paradigm = Game-Changer
| Benefit | How AI in Visual Paradigm Delivers It |
|---|---|
| Speed | Generate diagrams in seconds, not hours |
| Accuracy | UML-compliant, standards-aware, error-checked |
| Cost Savings | Reduce labor hours and rework |
| Scalability | Handle complex, nested, cloud-native environments |
| Collaboration | Share diagrams and chat histories across teams |
| Flexibility | Integrate with PlantUML, C4, ArchiMate, and more |
🌟 Bottom Line: The future of system design isn’t about drawing diagrams—it’s about thinking, discussing, and validating architecture with AI as your co-pilot.
So why spend hours on manual modeling when you can describe your vision in natural language and get a professional diagram instantly?
👉 Start now at chat.visual-paradigm.com and see the difference AI makes.
🔗 All Resources Mentioned in This Article:
- How to Create a UML Deployment Diagram for Cloud Apps with AI
- PlantUML Deployment Diagram Builder – Visual Paradigm Integration
- What is a Deployment Diagram? A Complete Guide to UML Deployment Diagrams
- Deployment Diagram Features in Visual Paradigm Software
- Comprehensive Tutorial on Deployment Diagrams with Visual Paradigm
- Beginner’s Guide to Deployment Diagrams Using Visual Paradigm Online
- Deployment Diagram in the Software Design Handbook
- Free Deployment Diagram Tool – Visual Paradigm Online
- How to Draw a Deployment Diagram in UML: Step-by-Step Tutorial
- Visual Paradigm User Guide: Creating Deployment Diagrams
💡 Pro Tip: Bookmark this page and return every time you’re designing a new system. With AI, your deployment diagrams aren’t just visual—they’re living, evolving blueprints of your system’s future.