Building a complex system without a clear map is akin to navigating a dense forest without a compass. In the world of systems analysis and design, the Context Diagram serves as that essential compass. It is the foundational layer upon which all detailed data modeling rests. Before diving into the intricate mechanics of internal processes, it is crucial to establish the boundaries of the system and its interaction with the outside world. This high-level view provides clarity, aligns expectations, and sets the stage for accurate requirements gathering.
Many teams rush into detailed process mapping without pausing to define the perimeter. This oversight often leads to scope creep, miscommunication, and significant rework later in the development lifecycle. By beginning with a Context Diagram, you establish a shared mental model among stakeholders. This document acts as a single source of truth regarding what the system does and, perhaps more importantly, what it does not do.
Defining the Boundary 🛑
A Context Diagram, often referred to as a Level 0 Data Flow Diagram (DFD), represents the entire system as a single process. It isolates the system from its environment to show how data enters and leaves. Think of the system as a black box. You do not need to see the gears turning inside yet; you only need to know what goes in and what comes out.
This abstraction is powerful. It allows analysts and developers to focus on the ecosystem surrounding the software rather than getting lost in the code immediately. The diagram highlights the critical interfaces between the system and external entities. These entities represent people, departments, or other systems that interact with your solution.
Without this boundary definition, the project team risks building features that fall outside the intended scope. For instance, a team might build a reporting module for internal use when the requirement was strictly for customer-facing analytics. A Context Diagram prevents this drift by visually confirming the scope with business owners before a single line of logic is written.
The Strategic Value of the Initial View 🧠
The decision to prioritize a Context Diagram is not merely a procedural step; it is a strategic necessity. There are several distinct advantages to starting here, each contributing to the overall health of the project.
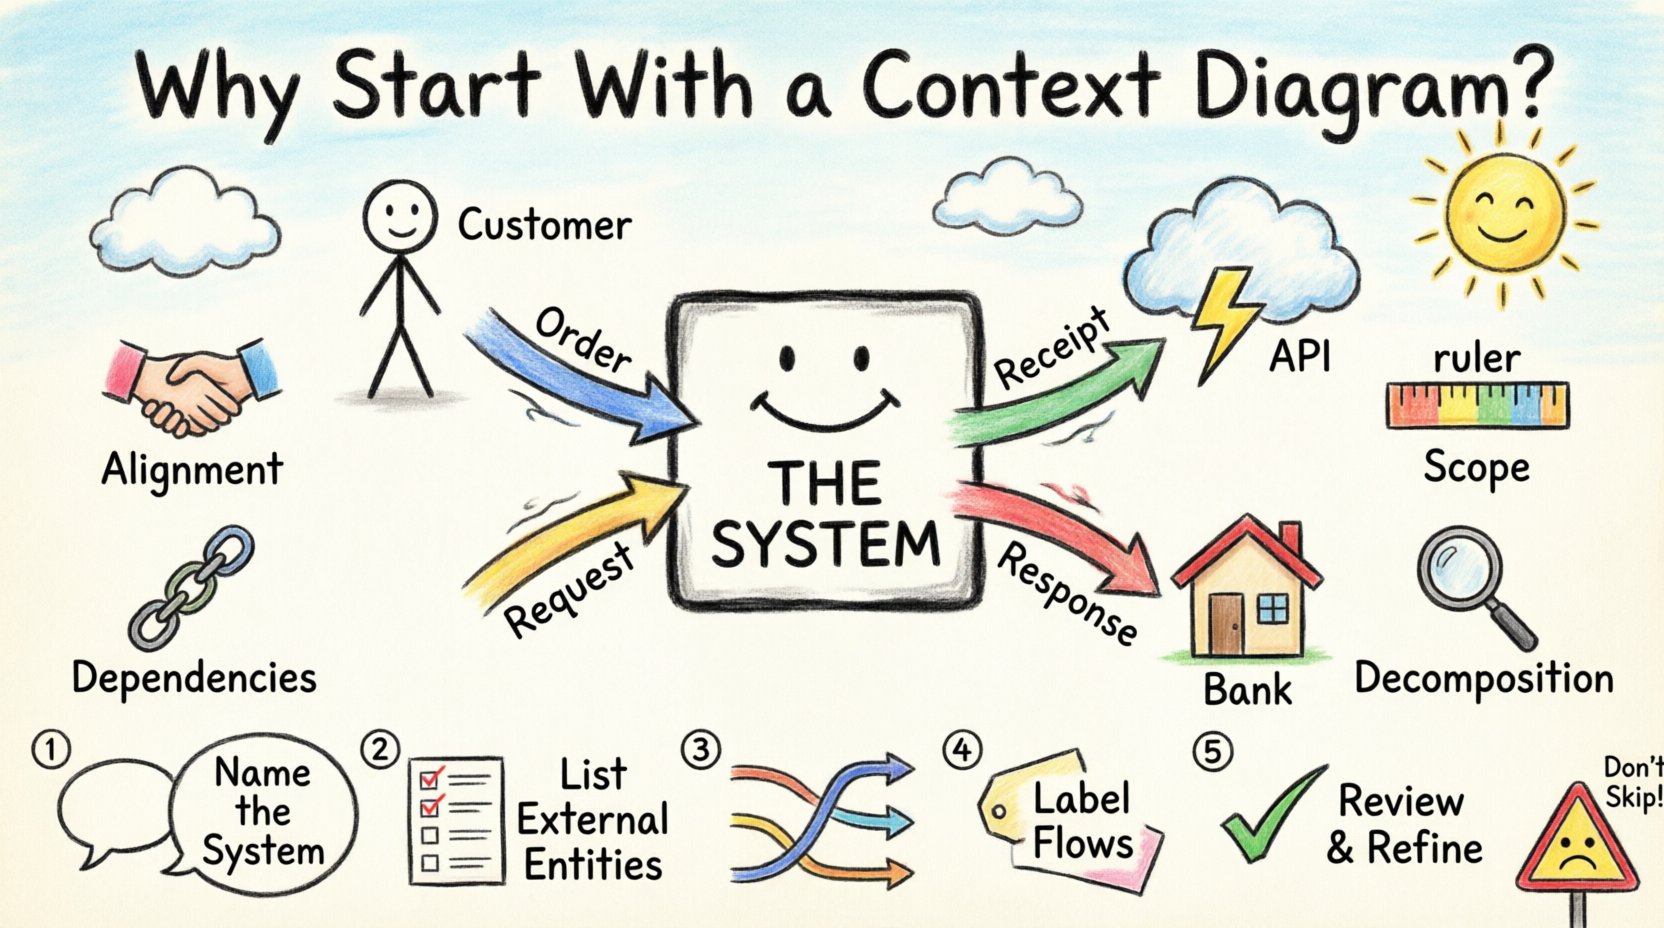
1. Stakeholder Alignment 🤝
Business analysts, developers, and clients often speak different languages. Developers think in logic and data structures; business owners think in outcomes and workflows. A Context Diagram bridges this gap. It uses simple symbols that are universally understood in the industry. When a stakeholder points to an arrow on the diagram, everyone understands it represents data movement. This visual common ground reduces ambiguity.
2. Scope Definition 📏
Scope creep is the silent killer of projects. It happens when requirements expand gradually without formal acknowledgment. A Context Diagram defines the perimeter explicitly. Anything outside the diagram is out of scope. This clarity helps manage expectations. If a stakeholder requests a feature that does not appear in the context flows, it is immediately flagged as a new requirement that may require a schedule adjustment.
3. Identification of External Dependencies 🔗
Systems rarely exist in a vacuum. They often rely on third-party APIs, legacy databases, or manual inputs from other departments. A Context Diagram forces the team to identify these dependencies early. Knowing that data comes from an external HR system, for example, impacts the design of the input modules and security protocols. Identifying these connections early prevents surprises during integration testing.
4. Foundation for Decomposition 🔍
Once the context is defined, the system can be decomposed into smaller, manageable processes. This is the transition to Level 1 DFDs. The Context Diagram provides the anchor point for this decomposition. It ensures that every sub-process eventually traces back to a valid external input or output. If a process cannot be traced to the context, it is likely unnecessary or disconnected.
Core Components Explained ⚙️
To create an effective Context Diagram, one must understand the four fundamental elements that comprise it. Each element serves a specific function in describing the flow of information.
- The Process (The System): This is represented by a single circle or rounded rectangle in the center. It is labeled with the name of the system. It represents the transformation of inputs into outputs.
- External Entities: These are represented by rectangles. They are the sources or destinations of data. Examples include Customers, Suppliers, Regulatory Bodies, or Third-Party Services.
- Data Flows: These are arrows connecting entities to the process. They represent the movement of information. Every arrow must have a label describing the data, such as “Order Details” or “Payment Confirmation”.
- Data Stores (Optional at Context Level): While Context Diagrams typically focus on flows in and out, sometimes high-level storage is shown to indicate data persistence, though strictly speaking, the focus is on the black box interaction.
It is vital to ensure that every arrow is labeled. An unlabeled arrow is useless because it does not convey what is being transmitted. Clarity in labeling prevents assumptions during the design phase.
Step-by-Step Construction 📝
Creating this diagram requires a logical approach. There is no software tool that can generate this automatically based on requirements alone; it requires human analysis. Follow this structured approach to ensure accuracy.
Step 1: Identify the System Name
Start by deciding what the system is. Is it the “Order Processing System” or just “Order Processing”? The name should be concise but descriptive. Place this in the central bubble. This defines the core subject of the analysis.
Step 2: Identify External Entities
List everyone or everything that interacts with the system. Ask the question: “Who provides data to the system?” and “Who receives data from the system?” Do not include internal departments that use the system; only include those outside the boundary. For example, a bank is an entity, but the internal finance team is not, as they are users of the system.
Step 3: Map the Data Flows
Draw arrows between the entities and the central process. Trace the path of every piece of information. If a customer submits an order, draw an arrow from Customer to System. If the system sends a receipt, draw an arrow from System to Customer. Ensure the direction is correct.
Step 4: Label the Flows
Write the name of the data on every arrow. Be specific. Instead of “Data,” use “Shipping Address.” Instead of “Info,” use “Invoice Number.” Specificity here reduces the risk of misinterpretation later.
Step 5: Validate the Balance
Check that every external entity has a reason to exist. If an entity has no input or output, it is not interacting with the system and should be removed. Also, ensure the system produces an output for every input. A system that takes data but produces nothing is usually incomplete.
Context vs. Level 1 DFD 📊
Understanding the relationship between the Context Diagram and the Level 1 Data Flow Diagram is essential for proper documentation. The table below outlines the key differences.
| Feature |
Context Diagram |
Level 1 DFD |
| Process Count |
Single Process (The System) |
Multiple Processes (Decomposed) |
| Detail Level |
High-Level Overview |
Intermediate Detail |
| Primary Goal |
Define Scope and Boundaries |
Define Internal Logic |
| Entities |
External Sources and Destinations |
External Sources and Destinations |
| Complexity |
Low |
High |
While the Context Diagram is simple, the Level 1 DFD breaks the central process into sub-processes. It shows how data moves between these internal steps. However, you cannot create a Level 1 DFD without first validating the Context Diagram. The inputs and outputs on the Level 1 diagram must match the flows on the Context diagram exactly.
Ensuring Accuracy and Validation ✅
Creating the diagram is only half the battle. The diagram must be accurate to be useful. Validation involves reviewing the model with the stakeholders who understand the business best. This is not a presentation to show off your skills; it is a verification session.
During validation, ask specific questions. “Does this flow represent the actual data sent?” “Are we missing any regulatory requirements?” “Is the data format correct?” Do not accept vague answers. If a stakeholder says “Data goes there,” ask for the name of the data packet.
Common challenges often arise during this phase. Stakeholders might forget to mention a specific data requirement because they assume it is obvious. It is the responsibility of the analyst to dig deeper. Do not rely on memory. Rely on the diagram.
Another challenge is the temptation to add too much detail. Resist the urge to show internal data stores or complex calculations at this stage. Keep it to the inputs and outputs. If a stakeholder asks about internal logic, defer that discussion to the Level 1 or Level 2 diagrams.
The Cost of Skipping This Step ⚠️
Teams that skip the Context Diagram often face significant technical debt. Without a clear boundary, developers may build features that are not needed. They might over-engineer the system to handle scenarios that were never part of the original scope. This leads to wasted resources and delayed timelines.
Furthermore, maintenance becomes difficult. If a new developer joins the project months later, the Context Diagram provides the quickest way to understand the system’s role within the larger ecosystem. Without it, they must read code or ask colleagues, which increases the risk of introducing errors.
Finally, regulatory compliance can be jeopardized. In industries like healthcare or finance, data boundaries are legal requirements. A Context Diagram helps visualize where sensitive data leaves the system. If you do not map this, you might inadvertently expose data to an unauthorized entity, leading to compliance violations.
Final Thoughts on System Design 🏁
Starting with a Context Diagram is a discipline that pays dividends throughout the project lifecycle. It forces a pause for thought before action. It transforms abstract requirements into a visual representation that can be scrutinized and corrected. By defining the black box first, you create a stable foundation for all subsequent design work.
This approach does not eliminate all risks, but it significantly reduces the likelihood of fundamental misunderstandings. It ensures that when the team begins to build, they are building the right system for the right purpose. In the complex landscape of software development, clarity is the most valuable asset you can possess. Begin with the context, and the details will follow naturally.