Refactoring is the process of restructuring existing computer code without changing its external behavior. It is a discipline that requires precision, understanding of architecture, and a clear vision of data movement. When dealing with complex systems, understanding how information travels between processes is often more critical than the code itself. This is where Data Flow Diagrams (DFDs) become an invaluable asset. By mapping the flow of data, developers can identify structural weaknesses and plan improvements systematically.
This guide explores how to utilize DFDs as a foundational tool during the refactoring lifecycle. We will examine the creation of current state models, the identification of inefficiencies, and the design of optimized future states. The goal is to enhance maintainability and performance while preserving functional integrity.
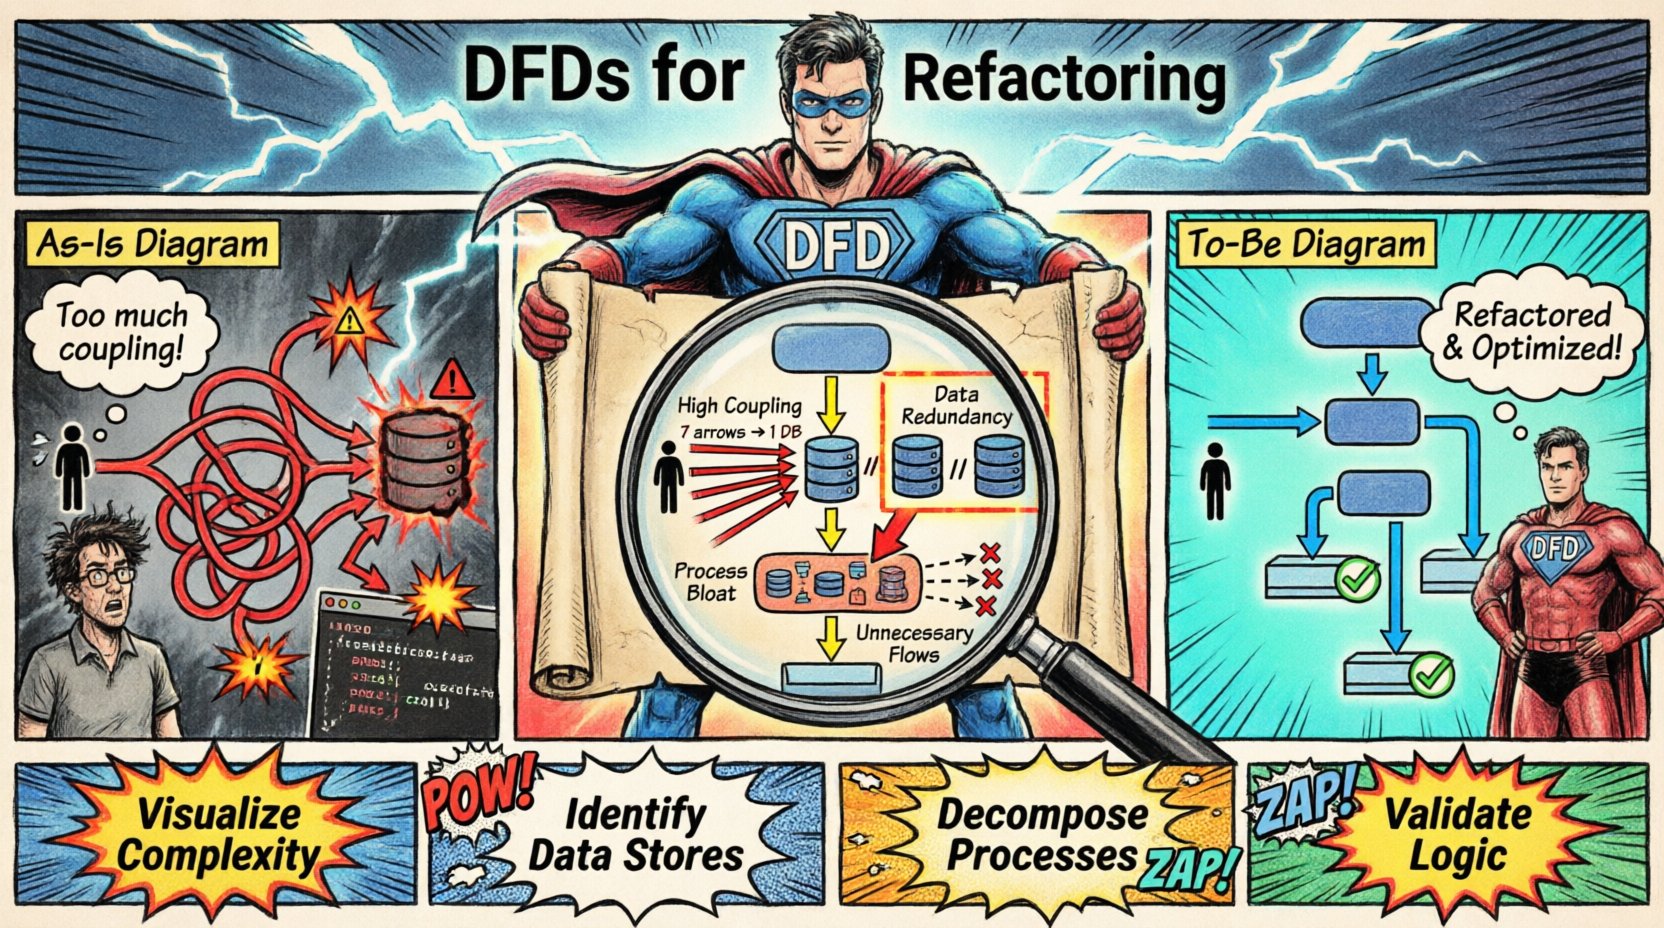
Understanding the Role of DFDs in Refactoring 📊
A Data Flow Diagram represents the flow of information through a system. It details how data enters the system, is processed, stored, and eventually exits. Unlike flowcharts, which focus on control flow and decision points, DFDs focus on data transformation. In the context of refactoring, this distinction is vital. Code refactoring often aims to improve internal structure (cohesion and coupling) rather than logic. A DFD provides a high-level abstraction that remains consistent even as the underlying implementation changes.
When you refactor code, you are often rearranging modules, extracting functions, or optimizing database queries. Without a map, these changes can inadvertently alter data paths. A DFD acts as a contract. It defines the expected input and output of every process. If a refactoring effort changes the data entering or leaving a module, the DFD must be updated to reflect this. If the data path remains the same, the refactoring is likely safe regarding external behavior.
Using DFDs helps in the following ways:
- Visualization of Complexity: It reveals hidden dependencies between modules that are not obvious in the code.
- Identification of Data Stores: It highlights where data persists, helping to optimize storage structures during refactoring.
- Process Decomposition: It allows teams to break down large, monolithic processes into smaller, manageable units.
- Validation of Logic: It ensures that no data is lost or created accidentally during structural changes.
Creating the As-Is Diagram 🏗️
The first step in any refactoring project is to document the current state. This is known as the As-Is diagram. It serves as the baseline against which all future changes are measured. To create this accurately, you must analyze the existing system. This involves tracing data from external entities through various processes to data stores and back out to external entities.
An external entity is a source or destination of data outside the system. This could be a user, a third-party service, or another application. A process represents a transformation of data. A data store is where data rests, such as a database table or a file. A data flow is the movement of data between these elements.
When documenting the As-Is state, do not worry about the implementation details yet. Focus on what the system does, not how it does it. For example, if a function calculates a tax value, represent it as a single process box. Do not map every line of code. The diagram should be at a level of abstraction that allows you to see the big picture. If the diagram becomes too cluttered, it loses its utility. Aim for clarity.
Here are key steps to build an accurate As-Is DFD:
- Identify External Entities: List all users and systems interacting with the application.
- Trace Data Entry: Map how data enters the system and which process receives it first.
- Map Processing Steps: Draw arrows showing how data moves from one process to another.
- Locate Data Stores: Mark where information is saved between processes.
- Verify Data Integrity: Ensure every data flow has a clear source and destination.
Identifying Inefficiencies and Flaws 🔍
Once the As-Is diagram is complete, it becomes a diagnostic tool. You can now analyze the diagram for patterns that indicate poor design. Common indicators include excessive data flows, processes that are too large, or data stores that are accessed by too many processes without clear governance.
Consider the concept of coupling. If a single data store is being written to by ten different processes, this indicates high coupling. During refactoring, this structure often needs to change. You might introduce an intermediary process to handle writes, or you might normalize the data to reduce redundancy. The DFD makes this visible immediately.
Another area of focus is the “black hole”. This occurs when a process receives data but produces no output. This is a logical error that must be corrected. Conversely, a “miracle” process is one that produces data without any input. Both scenarios suggest that the system logic is flawed or incomplete.
Table 1 below outlines common issues found in legacy DFDs and their potential refactoring implications.
| Issue |
Description |
Refactoring Action |
| High Coupling |
One process communicates with many others directly. |
Introduce a middleware layer or API gateway. |
| Data Redundancy |
Same data stored in multiple places. |
Consolidate data stores into a single source of truth. |
| Process Bloat |
A single process handles too many sub-tasks. |
Decompose into smaller, focused processes. |
| Unnecessary Flows |
Data moves between processes but is not used. |
Remove unused data flows and dependencies. |
Addressing these issues requires careful planning. You must ensure that the refactoring does not break the data contract. The DFD helps you predict where changes will ripple through the system.
Designing the To-Be Diagram 🚀
After identifying the problems, you design the To-Be diagram. This represents the ideal state of the system after refactoring. It should reflect the improvements you intend to make. This might involve removing redundant processes, merging data stores, or introducing new validation steps.
When designing the To-Be state, keep the external interface consistent. Users and external systems should not notice a change in how they interact with the application. Only the internal paths should change. This ensures backward compatibility and minimizes disruption.
For example, if you decide to move data processing from a synchronous operation to an asynchronous queue, the DFD will change. The data flow arrow will now point to a queue data store instead of a direct process. The user still sees the result, but the path has shifted. This architectural shift often improves scalability.
Key principles for the To-Be design include:
- Minimize Data Movement: Reduce the number of arrows. Less movement means less overhead.
- Separation of Concerns: Ensure each process handles a specific domain of data.
- Clarity of Storage: Clearly define which data is temporary and which is persistent.
- Scalability: Ensure the diagram supports future growth without structural collapse.
Mapping Changes and Implementation 🛠️
With both diagrams ready, you can map the changes. This is a critical phase where the theoretical model meets practical code. You must translate the To-Be DFD into technical requirements. This involves defining new database schemas, updating API endpoints, and rewriting module logic.
During implementation, it is helpful to keep the As-Is and To-Be diagrams side by side. This allows the team to verify that every change aligns with the plan. If a piece of code does not fit the new diagram, it needs to be revisited.
Testing is also essential. You should verify that the data entering the system matches the input defined in the diagram. Similarly, check that the output matches the expected results. Automated tests can help verify data flow consistency. If the data flows correctly, the refactoring is likely successful.
Validation and Maintenance ✅
Refactoring is not a one-time event. Systems evolve, and so do data flows. Once the new structure is in place, the To-Be diagram becomes the new standard. It should be updated whenever the system undergoes significant changes. This ensures the documentation remains accurate.
Maintaining the DFD requires discipline. Whenever a new feature is added, the diagram should be reviewed. This prevents the “death by a thousand cuts” scenario where the code drifts away from the original design intent. Regular reviews help catch deviations early.
Additionally, share the diagrams with the entire team. Developers, testers, and stakeholders benefit from understanding the data architecture. It creates a shared mental model of the system. When everyone understands how data moves, communication becomes easier and errors are reduced.
Conclusion on Structural Integrity 🏛️
Refactoring is a powerful technique for improving software quality. It allows teams to keep systems healthy and adaptable over time. By using Data Flow Diagrams, you gain a clear view of the system’s architecture. This visibility reduces risk and ensures that changes are deliberate and controlled.
Remember that the goal is not just to clean up code, but to ensure the system remains robust. The DFD provides the framework to achieve this. It connects the abstract concept of data with the concrete reality of implementation. By adhering to the principles outlined here, you can refactor with confidence and precision.