The strategic landscape of the modern economy is defined by volatility. Traditional frameworks, while foundational, often rely on static assumptions that no longer align with the speed of digital disruption, shifting consumer behaviors, and global supply chain fluidity. Michael Porter’s Five Forces framework remains a cornerstone of competitive strategy, yet relying on it in its original, static form can lead to strategic blindness. This guide details how to adapt the model for dynamic environments without discarding its core value. We will explore the necessary adjustments to each force and establish a review cadence that keeps your strategy aligned with reality.
Strategic planning is not a one-time event. It is an ongoing process of observation and adaptation. To maintain a competitive edge, organizations must treat industry analysis as a living document rather than a static report. This requires a shift from annual reviews to continuous monitoring of leading indicators.
Understanding the Traditional Framework ⚖️
Before updating the model, it is necessary to recall its original intent. Porter introduced the Five Forces in 1979 to explain why industries differ in profitability. The framework identifies five competitive forces that determine the intensity of competition and the profit potential of an industry:
- Threat of New Entrants: How easy is it for new competitors to enter the market?
- Bargaining Power of Suppliers: How much control do suppliers have over prices and terms?
- Bargaining Power of Buyers: How much pressure can customers exert to drive prices down?
- Threat of Substitute Products: Can customers find a different way to solve their problem?
- Rivalry Among Existing Competitors: How intense is the current competition?
In the 1970s, these forces operated within relatively stable industrial boundaries. Barriers to entry were often capital-intensive (factories, patents). Today, barriers are often intangible (network effects, data, ecosystem integration). The rules have changed, and the analysis must evolve to reflect current market dynamics.
Why Static Analysis Fails in Volatile Markets 📉
Applying a static Five Forces analysis to a fast-changing market creates a false sense of security. A report created today might be obsolete by next quarter. Several factors drive this obsolescence:
- Speed of Innovation: Technologies that were irrelevant five years ago may now define the industry.
- Customer Expectations: The demand for instant gratification and personalization alters buyer power significantly.
- Regulatory Shifts: Changes in data privacy, antitrust, or environmental standards can instantly alter supplier or entrant dynamics.
- Platform Economics: Markets are increasingly dominated by platforms rather than linear value chains, changing how value is captured.
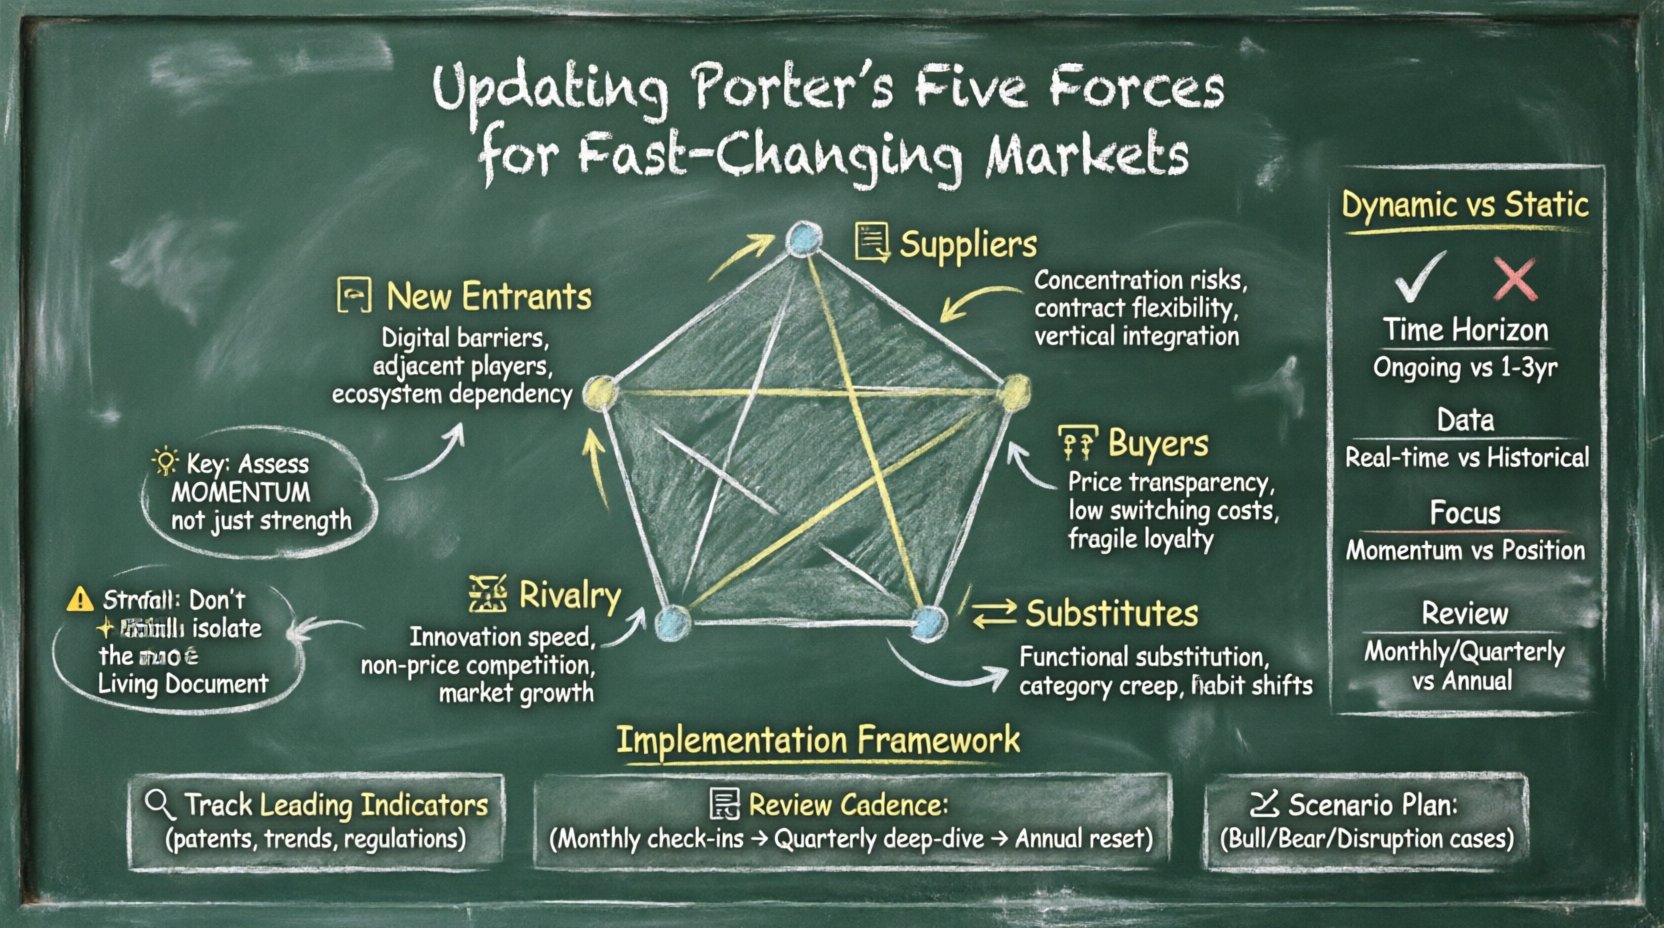
When forces shift rapidly, the gap between analysis and reality widens. To close this gap, the analysis must incorporate velocity. It is not enough to assess the *current* strength of a force; you must assess the *momentum* of that force.
Adapting Each Force for Dynamic Contexts 🛠️
To update the analysis, we must re-evaluate each of the five forces through the lens of volatility. The goal is to identify leading indicators of change rather than lagging indicators of past performance.
1. Threat of New Entrants 🚪
Traditionally, this force looked at capital requirements and economies of scale. In modern markets, the definition of “entrant” has expanded. New competitors often come from adjacent industries or utilize business models that bypass traditional barriers.
- Assess Digital Barriers: Look beyond physical assets. Evaluate the cost of acquiring user data, building network effects, or integrating APIs.
- Monitor Adjacent Players: Watch companies in related sectors that might pivot. A tech firm entering the financial sector is a common occurrence now.
- Regulatory Hurdles: Analyze if new regulations are lowering barriers (e.g., open banking) or raising them (e.g., stricter licensing).
- Ecosystem Dependency: Determine if the market relies on a single platform (like an app store) that could allow third parties to enter easily.
2. Bargaining Power of Suppliers 📦
Supplier power is no longer just about raw materials. In a digital economy, suppliers include talent, data providers, and technology partners. The power dynamic shifts based on scarcity and alternatives.
- Concentration Risks: Identify if you rely on a single cloud provider or a specific data source. Diversification reduces this risk.
- Commoditization of Inputs: As technology becomes more open-source or standardized, supplier power generally decreases.
- Vertical Integration: Are suppliers moving forward into your market? Monitor their product roadmaps closely.
- Contract Flexibility: In volatile markets, long-term fixed contracts can become liabilities. Assess the terms for renegotiation.
3. Bargaining Power of Buyers 🛒
Buyers have more information and switching options than ever before. The internet has reduced information asymmetry, empowering customers to compare prices and features instantly.
- Price Transparency: If comparison tools exist, buyer power is high. If your value is opaque, power remains lower.
- Switching Costs: Evaluate how easy it is for a customer to leave. Data portability and interoperability increase buyer power.
- Brand Loyalty: In fast-changing markets, loyalty is fragile. Loyalty is now tied to continuous value delivery, not just reputation.
- Consolidation: Watch for buyers merging. If a small buyer becomes a large distributor, their power increases significantly.
4. Threat of Substitute Products 🔄
Substitutes are not just direct competitors; they are alternative solutions to the customer’s underlying need. This is where the biggest disruptions often occur.
- Functional Substitution: Does a different technology solve the same problem? (e.g., video conferencing vs. business travel).
- Category Creep: Is your product becoming a feature within a larger suite? (e.g., spreadsheets becoming part of a business intelligence platform).
- Cost-Performance Ratio: If a substitute offers 80% of the value at 20% of the cost, it poses a significant threat.
- Consumer Habits: Track changes in how people work or live. Shifts in lifestyle often create new substitution opportunities.
5. Rivalry Among Existing Competitors ⚔️
Rivalry is the most visible force. In fast-changing markets, competition is often about speed and innovation rather than price wars.
- Innovation Cycles: Shorter product lifecycles increase rivalry. Constant updates are required to stay relevant.
- Market Growth: In a stagnant market, rivalry intensifies as players fight for share. In a growing market, competition may be softer.
- Exit Barriers: High exit barriers (specialized assets, emotional attachment) keep struggling competitors in the market, fueling conflict.
- Non-Price Competition: Focus on service quality, speed of delivery, and ecosystem integration rather than just price points.
Implementation Framework for Dynamic Review 📅
Updating the analysis requires a structured approach. You cannot simply guess the changes; you must measure them. The following framework outlines how to integrate these updates into your strategic planning cycle.
Step 1: Identify Leading Indicators 🔍
Instead of looking at last year’s revenue, identify metrics that predict future shifts. These might include:
- Patent filings by new entrants.
- Changes in supplier contract terms.
- Shifts in customer search trends.
- Regulatory proposals in draft stages.
- Adoption rates of new technologies within the sector.
Step 2: Establish a Review Cadence 🗓️
Annual reviews are insufficient for volatile markets. Consider a quarterly deep-dive with monthly light-touch updates.
- Monthly: Check leading indicators and news feeds.
- Quarterly: Re-evaluate the intensity of each force.
- Annually: Full strategic reset based on the Five Forces update.
Step 3: Scenario Planning 🎲
Create multiple versions of the Five Forces analysis. Do not rely on a single “base case.” Develop scenarios such as:
- Bull Case: High growth, low entry barriers, low rivalry.
- Bear Case: Low growth, high regulation, intense rivalry.
- Disruption Case: New technology renders the current business model obsolete.
Static vs. Dynamic Analysis Comparison 📊
Understanding the difference between a traditional static analysis and a dynamic one is crucial for implementation. The table below highlights the key distinctions.
| Aspect | Static Analysis | Dynamic Analysis |
|---|---|---|
| Time Horizon | 1-3 Years (Fixed) | Ongoing (Continuous) |
| Data Source | Historical Reports | Real-time Signals & Trends |
| Focus | Current Position | Momentum & Trajectory |
| Review Frequency | Annual | Quarterly or Monthly |
| Output | One-time Report | Living Strategy Document |
| Adaptability | Low | High |
Common Pitfalls to Avoid 🚫
Even with the right framework, teams often make mistakes when adapting the Five Forces model. Being aware of these common errors helps ensure the analysis remains robust.
- Ignoring the Ecosystem: Focusing only on direct competitors ignores the platform providers or partners that hold significant power.
- Over-reliance on Qualitative Data: While qualitative insights are valuable, they must be supported by quantitative metrics where possible.
- Internal Bias: Teams often assume their position is stronger than it is. Challenge internal assumptions with external data.
- Analysis Paralysis: Do not let the need for perfect data stop you from acting. Make decisions based on the best available information and iterate later.
- Isolating the Forces: Remember that the forces interact. A change in supplier power might alter buyer power. Analyze the interdependencies.
Integrating with Other Strategic Tools 🔗
The Five Forces analysis should not stand alone. It works best when combined with other strategic frameworks to provide a holistic view of the market.
- SWOT Analysis: Use the Five Forces to inform the “Threats” and “Opportunities” sections of a SWOT analysis.
- PESTLE Analysis: Use PESTLE to understand the macro-environmental factors that might shift the Five Forces (e.g., new laws affecting entry barriers).
- Value Chain Analysis: Use the Five Forces to identify where in the value chain you can capture more margin or defend against competition.
Measuring the Impact of Your Strategy 📈
Once you have updated the analysis and adjusted your strategy, you must measure the effectiveness of those changes. Key performance indicators (KPIs) should reflect the dynamic nature of the market.
- Market Share Velocity: How quickly are you gaining or losing share compared to the rate of change in the market?
- Customer Acquisition Cost (CAC) Trends: Is it getting harder or easier to acquire customers? This reflects buyer power and rivalry.
- Supplier Reliability Scores: Monitor disruptions or price hikes to assess supplier power.
- Innovation Pipeline: The rate at which you bring new features to market relative to competitors.
Final Considerations for Leaders 👥
Updating the Five Forces analysis is not merely an academic exercise. It is a critical leadership responsibility. Leaders must foster a culture where strategic intelligence is valued as highly as operational execution. This means allocating resources to market research, competitive intelligence, and scenario planning.
The goal is not to predict the future with certainty, but to be prepared for multiple futures. By treating the Five Forces as a dynamic model, you build resilience into your strategy. You move from reacting to changes to anticipating them.
Remember that no framework is perfect. The Five Forces model is a tool, not a crystal ball. Its value lies in the rigor of the thinking it forces upon the organization. When adapted for speed and volatility, it remains one of the most powerful tools for understanding the competitive landscape.
Start by auditing your current analysis. Identify which forces have shifted in the last 12 months. Document those changes. Then, build a process to track these shifts going forward. This disciplined approach ensures that your strategic decisions are grounded in the reality of the market, not the history of it.